Skip to main content
Consumer Goods & FMCG
E-Commerce
Economy & Politics
Energy & Environment
Health, Pharma & Medtech
Internet
Media
Technology & Telecommunications
Transportation & Logistics
Travel, Tourism & Hospitality
View all industries
Global data volume growth
Global AI market size
Number of generative AI users worldwide
Global inflation rate
Retail e-commerce sales worldwide
Largest economies worldwide
Biggest social media platforms by users
Global EV market share by manufacturer
International tourist arrivals by world region
Global annual CO₂ emissions
Browse recent statistics
Artificial intelligence (AI) worldwide
TikTok
Nvidia
E-commerce worldwide
Global GDP
Instagram
Apparel market worldwide
Video gaming worldwide
Global renewable energy industry
Influencer marketing worldwide
Browse recent topics
Consumer Trends 2026
Artificial Intelligence: in-depth market analysis
E-commerce challenges
Global economy
TikTok
Luxury goods: in-depth market analysis
Electric vehicles: A global overview
Video gaming worldwide
Travel and tourism trends 2026
Battery recycling worldwide
Browse recent reports
Explore the tool
Explore Classic mode
Advertising & Media
eCommerce
Consumer
Finance
Global Indicators
Health
Industrial
Mobility
Technology
Explore Market Insights
eCommerce Insights
Research AI
Book a demo
All integrations
Developer docs
Explore Statista Connect
Research
Strategy & Consulting
Marketing
Media & PR
Explore AI assistants
Marketing
Research & Development
Strategy
Sales
Find the fact
Tell the story
Win the pitch
Understand the market
Develop your strategy
Academia
Agencies
Consultancies
Consumer goods
Finance
Tech
Research solutions
Strategy consulting
Communication services
Explore Statista+
Statista R
Statista Healthcare
About Statista
First steps & help center
Webinar & training hub
Success stories
Individuals & Small Teams
Businesses & Enterprises
Academia & Government
English
Deutsch
Daily Data
Infographics on the topic "deutschland"
Self-Driving Cars
Oct 28, 2020
This chart shows the percentage of consumers who think fully self-driving vehicles will not be safe (2017-2020), by country.
More Information
Politics
Oct 8, 2020
This infographic charts the popularity of German Chancellor Merkel over her 15 years in power.
More Information
German Reunification
Oct 2, 2020
This chart shows differences in selected economic indicators between Western and Eastern Germany.
More Information
Migrants
Oct 1, 2020
This chart shows the top and bottom scoring countries in Gallup's Migrant Acceptance Index (top possible score is 9.0).
More Information
United States
Sep 16, 2020
This chart shows the share of the public with a favorable view of the United States.
More Information
Trump Administration
Jul 27, 2020
This chart shows the share approving of the job performance of U.S leadership in selected countries.
More Information
Covid-19 Outbreak
Jul 27, 2020
This chart shows the countries that are developing or that have rolled out Covid-19 tracing apps.
More Information
Europe
Jul 7, 2020
This chart shows the number of UK citizens acquiring German citizenship from 2000 to 2019.
More Information
COVID-19 Outbreak
Jun 16, 2020
This chart shows the share of people who would use an app providing information on people infected with Covid-19.
More Information
Discrimination
Jun 9, 2020
This chart shows the share of people who experienced discrimination due to the following characteristics in 2019 .
More Information
U.S. Military
Jun 8, 2020
This chart shows the countries hosting the most active-duty U.S. troops deployed overseas.
More Information
COVID-19 Outbreak
Apr 6, 2020
This chart shows the nationality of critically ill coronavirus patients transferred to German hospitals.
More Information
Food Waste
Mar 11, 2020
This chart shows the time after expiration date that certain foods are still considered edible.
More Information
Foreign Relations
Mar 10, 2020
This chart shows the percentage of people who say relations between the U.S. and Germany are good or bad in 2019.
More Information
Germany
Feb 18, 2020
This chart shows the estimated number of visitors to the Rose Monday parade.
More Information
Germany
Feb 17, 2020
This chart shows the foreign population as a share of the total population in German federal states (Nov 2018).
More Information
German Economy
Feb 14, 2020
This chart shows the percentage growth of industrial production in Germany in 2019.
More Information
Economy
Feb 14, 2020
This chart shows Germany's real GDP growth compared to the preceding quarter.
More Information
Germany
Dec 9, 2019
This chart shows average life expectancy in German federal states by gender (years).
More Information
Germany
Nov 25, 2019
This chart shows the number of female victims of domestic violence in Germany.
More Information
Germany
Nov 22, 2019
This chart shows household income in selected German cities in 2016.
More Information
Germany
Nov 12, 2019
This chart shows the estimated number of homeless people in Germany by year.
More Information
Disposable Income
Nov 7, 2019
This chart shows the EU regions with the highest & lowest annual disposable income per inhabitant
More Information
Germany
Nov 6, 2019
This chart shows life satisfaction in Germany by region in 2019.
More Information
Witch Trials
Oct 29, 2019
This chart shows people tried and executed in witch trials in Europe between 1300 and 1850.
More Information
Germany
Oct 28, 2019
This chart shows the results of previous state elections in Thuringia by year.
More Information
Germany
Oct 25, 2019
This chart shows Sonntagsfrage polling on Thuringia's state election in percent.
More Information
Netflix Value
Oct 23, 2019
This chart shows the average cost per title in U.S. dollars for a monthly Netflix subscription.
More Information
Digital Media
Oct 18, 2019
This chart shows the revenue of the digital media market in selected countries in 2023 (in billion U.S. dollars).
More Information
Wine Imports
Oct 2, 2019
The top wine importing countries in the world in 2018, by volume in millions of gallons.
More Information
Health
Sep 19, 2019
This chart shows the annual average share of publicly insured workers on sick leave in Germany.
More Information
Social Media Ads
Sep 18, 2019
This chart shows the sum of political ad spending on Snapchat in 2019 in U.S. dollars.
More Information
AI Use in Retail
Sep 12, 2019
This chart shows the AI use case distribution in retail organizations worldwide in 2018, by operating model.
More Information
Electricity Consumption
Sep 12, 2019
This chart shows electricity consumption per capita in 2016 (megawatt hours).
More Information
Clean Air
Sep 9, 2019
This chart shows the countries ranked by presence of indoor and outdoor air pollution.
More Information
Sponsored Post
Sep 3, 2019
The infographic is about venture capital flowing into Berlin startups.
More Information
German State Elections
Sep 2, 2019
This chart shows the results of the state election in Brandenburg & Saxony.
More Information
Cybersecurity
Aug 21, 2019
This chart shows consumers concerned about data misuse and taking taking active measures to protect their data.
More Information
Beer
Aug 2, 2019
This chart shows beer production by country in 2018 (billion litres)
More Information
Ad Market
Jul 31, 2019
This chart shows the advertising spending in the world's top ad markets in 2018 (in billion U.S. dollars).
More Information
Sponsored Post
Jul 29, 2019
This infographic shows data about AI startups in Berlin
More Information
Germany
Jul 26, 2019
This chart shows the average number of household members in federal states.
More Information
Sponsored Post
Jul 12, 2019
The infographic shows Berlin is a pioneer of urban mobility.
More Information
Germany
Jul 8, 2019
This chart shows politically motivated acts of violence with a right-wing extremist background per 100,000 inhabitants.
More Information
Berlin
Jul 5, 2019
This chart shows the average rent for an apartment in Berlin by district in 2018.
More Information
European Commission
Jul 4, 2019
This chart shows the satisfaction in Germany with the work of politician Ursula von der Leyen in 2019.
More Information
Germany
Jun 27, 2019
This chart shows the number of long-distance bus-services offered in Germany.
More Information
Plastic Waste
Jun 20, 2019
This chart shows trade flows of the largest exporters of plastic waste in the world.
More Information
Germany
Jun 6, 2019
This chart shows the development of German postal prices for a standard letter.
More Information
Germany
Jun 6, 2019
This chart shows average SPD polling approval since Andrea Nahles took over party leadership.
More Information
Sponsored Post
Jun 5, 2019
This infographic shows that Berlin has become a motor of Germany’s economic development.
More Information
Trade Partners
Jun 3, 2019
This chart shows the year-to-date total trade in goods as of March 2019.
More Information
European Elections
May 27, 2019
This chart shows the voting results of Germans aged 30 or below at the 2019 European Elections.
More Information
Germany
May 23, 2019
This chart shows voting intention in Germany for the 2019 European Elections.
More Information
Germany
May 23, 2019
This chart shows usage of plastic shopping bags in Germany by year.
More Information
Huawei Ban
May 22, 2019
Share of respondents whose main smartphone was manufactured by Huawei in 2019.
More Information
Ransomware
May 15, 2019
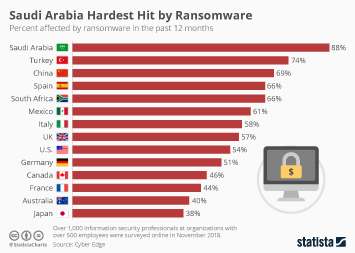
This chart shows the percent affected by ransomware in the past 12 months.
More Information
U.S. Tariffs
May 13, 2019
This chart shows the applied tariff rates on all products by country.
More Information
Apr 17, 2019
This chart shows EU chocolate production in 2017 (million tonnes).
More Information
ePublishing
Apr 16, 2019
This chart shows the revenue forecast and growth rate (in billion USD) for ePublishing in selected countries.
More Information
Brexit
Apr 11, 2019
This chart shows the share of respondents with the following views about Brexit.
More Information
Population Density
Apr 10, 2019
This chart show the ratio of national population to land area in people per square kilometers by select countries for 2017.
More Information
Germany
Apr 9, 2019
This chart shows the total rent of a room in a shared flat for the 2019 summer semester in Germany.
More Information
German Tax System
Apr 9, 2019
This chart shows the number of tax returns submitted electronically in Germany (millions).
More Information
European Union
Apr 8, 2019
This chart shows harvested potato production and share of EU-2018 total in 2015.
More Information
Germany
Apr 4, 2019
This chart shows the number of social apartments per 1,000 inhabitants by federal state in 2015.
More Information
Berlin
Apr 4, 2019
This chart shows housing costs as a share of purchasing power in Berlin by district (2013 & 2016).
More Information
International Worries
Mar 22, 2019
This chart shows the percent of people that identify each risk as one of their top three short term risks, by country in 2018.
More Information
Smart Home
Mar 18, 2019
This chart shows smart home revenue and penetration rate in 2018, by country.
More Information
Ship Scrapping
Mar 13, 2019
This chart shows the locations in which most ships are scrapped worldwide as well as the countries of the shipowners.
More Information
Tinder revenue
Mar 8, 2019
This chart shows the net revenue of the Tinder app on the Apple App Store and Google Play Store in 2018 in different European countries.
More Information
Germany
Mar 8, 2019
This chart shows the share of respondents agreeing with the following statements in 2019.
More Information
Germany
Mar 6, 2019
This chart shows the share of women in the Bundeswehr by year (%).
More Information
Germany
Mar 6, 2019
This chart shows the total number of Bundeswehr personnel from 1959 to 2018.
More Information
Electricity Access
Mar 1, 2019
Proportion of primary schools with access to electricity, by country in 2017.
More Information
Uber app
Mar 1, 2019
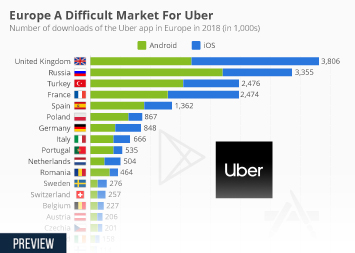
This chart shows the number of downloads of the Uber app on the Apple App Store and Google Play Store in 2018 in different European...
More Information
Netflix app in Europe
Feb 19, 2019
This chart shows the number of downloads and the in-app purchase net revenue of the Netflix app in 2018 in different European countries.
More Information
Social Media Advertising
Feb 5, 2019
This chart shows the social media advertising revenue in selected countries in Europe in 2018 (in million U.S. dollars).
More Information
German Autobahn
Jan 28, 2019
This chart shows the expected change in emissions by limiting autobahn speeds to 120kmh.
More Information
German Tax System
Jan 28, 2019
This chart shows the days of processing time per tax return in tax offices in 2018.
More Information
Internet Use
Jan 25, 2019
This chart shows the share of people who had used the internet in the past 3 months, by country.
More Information
Mortgage lending
Jan 24, 2019
This chart shows the share of the population in Europe who are owner-occupiers in 2018, split by whether or not they have an outstanding...
More Information
EU Army
Jan 24, 2019
This chart shows the percentage of respondents who support the creation of an EU army (2017).
More Information
Railway Investment
Jan 21, 2019
This chart shows the level of investment in rail infrastructure per citizen in European countries in 2017.
More Information
EU
Jan 17, 2019
This chart shows the percent of people who agree that their voice counts in the EU, by country.
More Information
E-commerce returns
Jan 14, 2019
This chart shows the share of the population who returned online purchases in selected European countries in 2018.
More Information
Alcohol Imports
Dec 17, 2018
This chart shows the top importers of champagne in 2017 in millions of bottles of 75 cl.
More Information
Mobile Internet
Dec 13, 2018
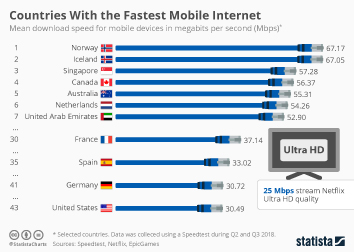
This chart shows the mean download speed for mobile devices in megabits per second (Mbps).
More Information
Instagram users
Nov 30, 2018
This chart shows the share of the population that use Instagram in the EU-28, Norway, Switzerland, Russia and Turkey as of October...
More Information
Facebook users
Nov 30, 2018
This chart shows the share of the population that use Facebook in the EU-28, Norway, Switzerland, Russia and Turkey as of October 2018.
More Information
3
/
5
Contact
Get in touch with us. We are happy to help.
Do you still have questions?
Feel free to contact us anytime using our
contact form
or visit our
FAQ page
.
Your contact to the Infographics Newsroom
Felix Richter
Data Journalist
felix.richter@statista.com
+49 (40) 284 841 557