Skip to main content
Consumer Goods & FMCG
E-Commerce
Economy & Politics
Energy & Environment
Health, Pharma & Medtech
Internet
Media
Technology & Telecommunications
Transportation & Logistics
Travel, Tourism & Hospitality
View all industries
Global data volume growth
Global AI market size
Number of generative AI users worldwide
Global inflation rate
Retail e-commerce sales worldwide
Largest economies worldwide
Biggest social media platforms by users
Global EV market share by manufacturer
International tourist arrivals by world region
Global annual CO₂ emissions
Browse recent statistics
Artificial intelligence (AI) worldwide
TikTok
Nvidia
E-commerce worldwide
Global GDP
Instagram
Apparel market worldwide
Video gaming worldwide
Global renewable energy industry
Influencer marketing worldwide
Browse recent topics
Consumer Trends 2026
Artificial Intelligence: in-depth market analysis
E-commerce challenges
Global economy
TikTok
Luxury goods: in-depth market analysis
Electric vehicles: A global overview
Video gaming worldwide
Travel and tourism trends 2026
Battery recycling worldwide
Browse recent reports
Explore the tool
Explore Classic mode
Advertising & Media
eCommerce
Consumer
Finance
Global Indicators
Health
Industrial
Mobility
Technology
Explore Market Insights
eCommerce Insights
Research AI
Book a demo
All integrations
Developer docs
Explore Statista Connect
Research
Strategy & Consulting
Marketing
Media & PR
Explore AI assistants
Marketing
Research & Development
Strategy
Sales
Find the fact
Tell the story
Win the pitch
Understand the market
Develop your strategy
Academia
Agencies
Consultancies
Consumer goods
Finance
Tech
Research solutions
Strategy consulting
Communication services
Explore Statista+
Statista R
Statista Healthcare
About Statista
First steps & help center
Webinar & training hub
Success stories
Individuals & Small Teams
Businesses & Enterprises
Academia & Government
English
Deutsch
Daily Data
Infographics on the topic "uk"
Brexit
Dec 9, 2019
This chart shows the percentage of EU citizens living in the UK who have or haven't considering leaving due to Brexit.
More Information
Cinema
Dec 5, 2019
This chart shows the % of the UK public considering the following their favourite Bond actor (April 2019).
More Information
Energy
Dec 4, 2019
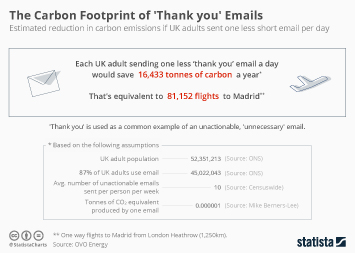
This chart shows the estimated reduction in carbon emissions if UK adults sent one less short email per day.
More Information
Rail Travel
Dec 2, 2019
This chart shows a breakdown of how money made via rail fares is spent in Great Britain.
More Information
United Kingdom
Dec 2, 2019
This chart shows the foreign politicians of which the largest share of people in the UK have a positive opinion in 2019.
More Information
Employment
Dec 2, 2019
This chart shows the average annual number of strike days per 1,000 employees in selected OECD countries.
More Information
Health Service
Nov 28, 2019
This chart shows responses in the UK to the following statement: 'I am worried about how a trade deal with the US could impact the...
More Information
Trade War
Nov 28, 2019
This chart shows the number of trade restrictions passed between 2008 and 2019 in selected countries.
More Information
UK Election
Nov 27, 2019
This chart compares UK voter registration applications from the day of elections being called to the registration deadlines.
More Information
UK Election
Nov 27, 2019
This chart shows the number of voter registration applications in the United Kingdom from 29 October to 26 November 2019, by age group.
More Information
Employment
Nov 25, 2019
This infographic shows the average annual gross pay of UK employees in the top earning percentiles in 2019.
More Information
Election 2019
Nov 25, 2019
This chart shows general election voting intention for selected parties in Great Britain, by age group in November 2019.
More Information
UK Election
Nov 22, 2019
This chart breaks down the expected Income raised by 2023-24 through tax measures proposed in the 2019 Labour manifesto.
More Information
Health in the UK
Nov 21, 2019
This chart shows the share that have taken prescribed medicines in the last week in England, by amount and age group.
More Information
Donkeys
Nov 21, 2019
This chart shows the change in donkey population in selected countries.
More Information
UK Politics
Nov 20, 2019
This chart shows the UK public's reaction to the 19 November ITV election debate.
More Information
UK Politics
Nov 19, 2019
This chart shows the share saying they would vote for the Brexit Party in a general election over the course of 2019.
More Information
International Trade
Nov 18, 2019
This chart shows the percentage change in U.S. goods imports from its top import partners from January through September 2019 compared...
More Information
Banking
Nov 18, 2019
This chart shows the number of bankers who earned €1 million or more by country in 2017.
More Information
Chelsea
Nov 13, 2019
This chart shows Chelsea's leaked internal player fines for the 2019-20 season (GBP).
More Information
Environment
Nov 12, 2019
This chart reveals the European countries with the most carbon dioxide equivalent air emissions in 2017.
More Information
UK Election
Nov 12, 2019
This chart shows how people in Britain feel about the upcoming 2019 election.
More Information
Movember
Nov 11, 2019
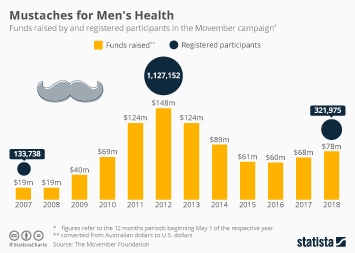
This chart shows the amount raised by the annual Movember campaign since 2007.
More Information
Poppy Appeal
Nov 11, 2019
This chart shows total funds generated through the Poppy Appeal (in £ million).
More Information
Motorists
Nov 8, 2019
This chart shows the top cited 'most annoying' behaviours by drivers in the UK in 2019.
More Information
Employment
Nov 8, 2019
This chart shows the most commonly cited reasons for days lost through sickness absence in the UK in 2018.
More Information
UK Politics
Nov 7, 2019
This chart looks at how students in the UK will vote tactically in the next general election.
More Information
Syria
Nov 6, 2019
This chart shows the targets of RAF air attacks against ISIS in Iraq & Syria (Oct 17-Sep 19).
More Information
Politics
Nov 1, 2019
This chart is a collection of the most recent voting intention polls in Great Britain as of 1 November 2019.
More Information
Brexit
Oct 30, 2019
This chart gives an overview of the key parliamentary votes in which Boris Johnson and his government were considered defeated.
More Information
Brexit
Oct 25, 2019
This chart shows the share of GB adults that support or oppose calling an immediate general election.
More Information
Discrimination
Oct 24, 2019
This chart shows discrimination experienced by respondents (personally or as a witness) in the workplace (%).
More Information
Income Tax
Oct 23, 2019
More Information
Brexit
Oct 23, 2019
This chart shows the share of the UK's public approving of British and EU leadership.
More Information
Millionaires
Oct 22, 2019
This chart shows countries by the number of dollar millionaires in 2019.
More Information
United Kingdom
Oct 22, 2019
This flow chart covers potential Brexit scenarios and likely outcomes after the vote on the Brexit deal on 22 October 2019.
More Information
Demographics
Oct 22, 2019
This chart shows UK population mid-year estimates and projections from 1993 to 2043.
More Information
Air Travel Emissions
Oct 22, 2019
This chart shows the estimated global share of commercial air travel CO2 emissions in 2018.
More Information
UK
Oct 21, 2019
This chart shows public opinion on the Brexit deal negotiated by the Boris Johnson government in October 2019.
More Information
Digital Media
Oct 18, 2019
This chart shows the revenue of the digital media market in selected countries in 2023 (in billion U.S. dollars).
More Information
United Kingdom
Oct 17, 2019
This chart shows public opinion on how UK party leaders are handling Brexit.
More Information
United Kingdom
Oct 17, 2019
This flow chart covers potential Brexit scenarios and likely outcomes after the EU summit in October 2019.
More Information
Climate
Oct 16, 2019
This chart shows UK public opinion on the October 2019 Extinction Rebellion protests.
More Information
Health
Oct 15, 2019
This chart shows the common types of cancer in England, by gender.
More Information
Charity
Oct 15, 2019
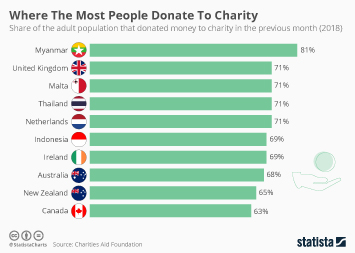
This chart shows the countries in which the largest share of the adult population have donated money to charity in the last month.
More Information
Hate Crime
Oct 15, 2019
This chart shows the total number of hate crimes recorded by police in England and Wales.
More Information
Travel
Oct 15, 2019
This chart shows the average estimated waiting times for security checks at large UK airports.
More Information
World Record
Oct 14, 2019
This chart shows the world record marathon progression for women (in hours: minutes: seconds).
More Information
Nobel Prize
Oct 14, 2019
This chart shows the share of immigrants among U.S. winners of Nobel Prizes in the sciences.
More Information
Media Revenue
Oct 14, 2019
This chart shows the television industry revenue in the UK from 2004 to 2018 by source (in billion GBP).
More Information
Drugs
Oct 11, 2019
This chart shows the estimated daily cocaine consumption based on waste water analysis in selected cities.
More Information
Survey
Oct 10, 2019
This chart shows how having certain pets could affect the willingness of people to date you in the UK.
More Information
Mental Health
Oct 10, 2019
This chart shows the share of GB adults saying their current mental health is in general 'fairly' or 'very' bad, by demographic.
More Information
Biodiversity
Oct 4, 2019
This chart shows key facts about the UK's biodiversity in October 2019.
More Information
Patents
Oct 4, 2019
This chart shows the proportion of female inventors associated with global patent applications.
More Information
Wine Imports
Oct 2, 2019
The top wine importing countries in the world in 2018, by volume in millions of gallons.
More Information
Patent Applications
Oct 2, 2019
This chart shows the proportion of female inventors in patent applications from 1998 to 2017.
More Information
Work & Travel
Sep 30, 2019
Thic chart shows countries that are part of Australia's work and travel program and the year they joined.
More Information
European Union
Sep 30, 2019
This chart shows the UK contribution to the EU budget in 2018.
More Information
News consumption
Sep 26, 2019
This chart shows how different age groups have different preferences regarding their main source of news.
More Information
Crime
Sep 25, 2019
This chart show the UK football clubs with the most fans with existing banning orders in the 2018/19 season.
More Information
UK Politics
Sep 24, 2019
This chart shows the share of GB adults that agree/disagree with the Supreme Court ruling that the prorogation of parliament was unlawful.
More Information
Sep 24, 2019
This chart shows the worst net satisfaction rates of each leader of the opposition since 1977 in the UK.
More Information
UK Politics
Sep 24, 2019
This chart shows public opinion on the prorogation of the UK parliament in 2019.
More Information
Banking
Sep 24, 2019
This chart shows the share of branches closed between Jan '15 and Aug '19 in the UK, by bank.
More Information
Retail
Sep 23, 2019
This chart shows the fastest growing eCommerce stores in the UK from 2017 and 2018.
More Information
Rugby World Cup
Sep 20, 2019
This chart shows the most successful teams at the Rugby World Cup.
More Information
Brexit
Sep 19, 2019
This infographic charts the popularity of Boris Johnson and Jeremy Corbyn.
More Information
Environment
Sep 17, 2019
This chart shows the share saying they think the climate is changing and human activity is mainly responsible in 2019, by country.
More Information
Rugby World Cup
Sep 13, 2019
This chart shows international Rugby World Cup ticket sales by nationality.
More Information
Rugby
Sep 13, 2019
This chart compares the World Rugby Rankings from August 2007 and September 2019.
More Information
EU Protected Origin
Sep 12, 2019
This chart shows selected food and drink of EU protected origin (PDO/PGI/GI).
More Information
Electricity Consumption
Sep 12, 2019
This chart shows electricity consumption per capita in 2016 (megawatt hours).
More Information
Drones
Sep 12, 2019
This chart shows near-misses between drones and planes in the UK.
More Information
Northern Ireland
Sep 12, 2019
This chart shows responses to "if there was a referendum tomorrow, how would you vote?"
More Information
Suicide Prevention Week
Sep 11, 2019
This chart show suicide deaths by cause in the U.S. in 2017.
More Information
Brexit
Sep 10, 2019
This chart shows responses to a survey question on how the UK prime minister should approach requesting an Article 50 extension.
More Information
Mental Health
Sep 10, 2019
This chart shows the share of UK adults that have experienced negative impacts on mental wellbeing due to their body image.
More Information
News Apps
Sep 9, 2019
This chart shows the percent of phones select apps were found on.
More Information
Brexit
Sep 9, 2019
This chart shows the number of times MPs have changed party since 1945.
More Information
Sep 6, 2019
This chart shows the most surveilled cities in Europe (2019).
More Information
United Kingdom
Sep 6, 2019
This flow chart covers potential Brexit scenarios and likely outcomes as of September 2019.
More Information
Facebook
Sep 6, 2019
This chart shows a ranking of social media platforms according to the impact on youth mental health.
More Information
Soft Power
Sep 5, 2019
This chart shows the countries in which the most current world leaders received higher education as of 2019.
More Information
Brexit
Sep 4, 2019
This chart shows the projected seat distribution in the event of a snap election in the UK before 31 October 2019.
More Information
UK Politics
Sep 4, 2019
This chart shows the composition of the House of Commons as of 3 September 2019.
More Information
Brexit
Sep 3, 2019
This chart shows the ten most-signed petitions under the current UK government.
More Information
Tourism
Sep 2, 2019
This chart shows the share who feel locals in other countries have a negative view of their tourists.
More Information
Sustainability
Aug 29, 2019
This chart shows the estimated water required in the production of clothing items.
More Information
United Kingdom
Aug 29, 2019
This chart shows House of Commons sitting days by session since 1945.
More Information
12
/
25
Contact
Get in touch with us. We are happy to help.
Do you still have questions?
Feel free to contact us anytime using our
contact form
or visit our
FAQ page
.
Your contact to the Infographics Newsroom
Felix Richter
Data Journalist
felix.richter@statista.com
+49 (40) 284 841 557