Skip to main content
Consumer Goods & FMCG
E-Commerce
Economy & Politics
Energy & Environment
Health, Pharma & Medtech
Internet
Media
Technology & Telecommunications
Transportation & Logistics
Travel, Tourism & Hospitality
View all industries
Global data volume growth
Global AI market size
Number of generative AI users worldwide
Global inflation rate
Retail e-commerce sales worldwide
Largest economies worldwide
Biggest social media platforms by users
Global EV market share by manufacturer
International tourist arrivals by world region
Global annual CO₂ emissions
Browse recent statistics
Artificial intelligence (AI) worldwide
TikTok
Nvidia
E-commerce worldwide
Global GDP
Instagram
Apparel market worldwide
Video gaming worldwide
Global renewable energy industry
Influencer marketing worldwide
Browse recent topics
Consumer Trends 2026
Artificial Intelligence: in-depth market analysis
E-commerce challenges
Global economy
TikTok
Luxury goods: in-depth market analysis
Electric vehicles: A global overview
Video gaming worldwide
Travel and tourism trends 2026
Battery recycling worldwide
Browse recent reports
Explore the tool
Explore Classic mode
Advertising & Media
eCommerce
Consumer
Finance
Global Indicators
Health
Industrial
Mobility
Technology
Explore Market Insights
eCommerce Insights
Research AI
Book a demo
All integrations
Developer docs
Explore Statista Connect
Research
Strategy & Consulting
Marketing
Media & PR
Explore AI assistants
Marketing
Research & Development
Strategy
Sales
Find the fact
Tell the story
Win the pitch
Understand the market
Develop your strategy
Academia
Agencies
Consultancies
Consumer goods
Finance
Tech
Research solutions
Strategy consulting
Communication services
Explore Statista+
Statista R
Statista Healthcare
About Statista
First steps & help center
Webinar & training hub
Success stories
Individuals & Small Teams
Businesses & Enterprises
Academia & Government
English
Deutsch
Daily Data
Infographics on the topic "uk"
Immigration
Jan 23, 2019
This chart shows public support for high skilled immigration/share of immigrants with a college degree in 2019
More Information
World Wealth
Jan 23, 2019
This chart shows an overview of global wealth and poverty.
More Information
United Kingdom
Jan 23, 2019
This chart shows forecast change in real gross value added (GVA) by 2034 in the case of a no deal Brexit, by region/country.
More Information
New Study
Jan 22, 2019
This chart shows the threats to business growth that global CEOs are 'extremely concerned' about in 2019.
More Information
United Kingdom
Jan 18, 2019
This chart shows the percentage point difference between NHS England's performance and its waiting times standards.
More Information
Trade
Jan 18, 2019
This chart shows the UK's level of food self-sufficiency from 1987 to 2017.
More Information
EU
Jan 17, 2019
This chart shows the percent of people who agree that their voice counts in the EU, by country.
More Information
United Kingdom
Jan 16, 2019
This chart shows what people in Britain think will happen with Brexit after the prime minister's deal was rejected.
More Information
Brexit
Jan 16, 2019
This chart explains the 'vote of no confidence' process in UK politics.
More Information
Brexit
Jan 16, 2019
This chart shows the margin of defeat for government motions since 1918.
More Information
Apps
Jan 15, 2019
This chart shows the apps with the highest number of downloads from the Play Store in the UK in 2018.
More Information
New Figures
Jan 15, 2019
This chart shows the European countries where the largest share of pensioners are at risk of poverty in 2017.
More Information
United Kingdom
Jan 14, 2019
This chart looks at remain and leave voters' attitudes to potential Brexit fallout scenarios.
More Information
Brexit
Jan 11, 2019
This chart presents rolling three-month GDP growth in the United Kingdom.
More Information
Inflation
Jan 8, 2019
This chart shows most zeros slashed in a currency redenomination.
More Information
Jan 8, 2019
This chart shows the estimated length of peak time M20/A20 traffic queue in 2018, by length of Dover customs checks.
More Information
New Analysis
Jan 7, 2019
This chart shows figures related to unsecured debt in the United Kingdom in Q3 2018.
More Information
Refugees
Jan 4, 2019
This chart shows the number of refugees attempting to cross the following in 2018
More Information
Media Consumption
Jan 4, 2019
This chart shows the estimated digital and physical share of media consumed in the UK, by type.
More Information
UK Entertainment Sales
Jan 4, 2019
This chart shows physical and digital entertainment sales in the UK in 2018.
More Information
United Kingdom
Jan 2, 2019
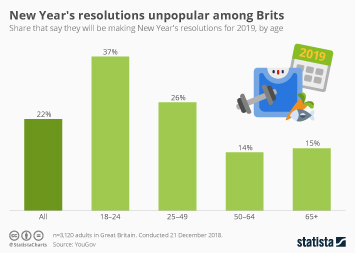
This chart shows the share of Brits that say they will be making New Year's resolutions for 2019, by age.
More Information
Migration
Dec 20, 2018
This chart shows the European countries which have the largest proportion of migrants in their population in 2017.
More Information
EU Referendums
Dec 20, 2018
This chart shows referendums on Europe that were put to a second vote.
More Information
Election Interference
Dec 19, 2018
This chart shows the average monthly volume of posts by Russia's Internet Research Agency.
More Information
United Kingdom
Dec 18, 2018
This chart shows the cumulative real pay loss since 2008.
More Information
Alcohol Imports
Dec 17, 2018
This chart shows the top importers of champagne in 2017 in millions of bottles of 75 cl.
More Information
United Kingdom
Dec 17, 2018
This chart shows the share of speaking appearances made after four days of the Brexit debate, by party.
More Information
Gun Deaths
Dec 13, 2018
This chart shows the number of U.S. gun deaths due to firearms (1999-2017).
More Information
New Report
Dec 11, 2018
This chart shows the estimated number of jobs that would be lost due to a 'no deal' Brexit, by region.
More Information
France
Dec 10, 2018
This chart reveals French public opinion on the 'yellow vests' movement.
More Information
Crime
Dec 10, 2018
This chart shows the results of a survey into whether people in Great Britain consider certain situations to be rape or not.
More Information
United Kingdom
Dec 10, 2018
This chart shows the number employed and in-work poverty rate in the UK.
More Information
United Kingdom
Dec 7, 2018
This chart shows the age-standardised alcohol-specific death rate per 100,000 people.
More Information
Traffic
Dec 7, 2018
This chart shows European capital cities by peak hours spent in traffic congestion in 2017.
More Information
Education
Dec 7, 2018
This chart shows the universities with the highest and lowest shares of entrants from state schools in 2016-17.
More Information
New Ranking
Dec 3, 2018
This chart shows the number of visa free countries passport holders can visit in 2018. <a href=""></a>
More Information
OPEC
Dec 3, 2018
This chart shows the estimated oil barrel prices needed to balance domestic budgets of selected OPEC members in 2019.
More Information
Banking
Nov 30, 2018
This chart shows the countries with the largest share of banks, assets and employment in Europe in 2017.
More Information
United Kingdom
Nov 30, 2018
This chart shows Excess winter deaths in England and Wales 1975 to 2018.
More Information
Facebook users
Nov 30, 2018
This chart shows the share of the population that use Facebook in the EU-28, Norway, Switzerland, Russia and Turkey as of October 2018.
More Information
New Analysis
Nov 29, 2018
This chart presents the estimated economic impact of Brexit on the UK in different leave scenarios.
More Information
United Kingdom
Nov 27, 2018
This chart reveals figures related to Trussell Trust three-day emergency food supplies in December.
More Information
New Report
Nov 26, 2018
This chart shows the predicted effect on the UK economy by 2030 if it leaves the EU in 2021.
More Information
Europe
Nov 23, 2018
This chart presents key figures related to the British overseas territory of Gibraltar.
More Information
European Union
Nov 22, 2018
This chart shows the number of false media accusations debunked by the EU from 1992 to 2017.
More Information
New Report
Nov 22, 2018
This chart shows the number of people recorded homeless by Shelter in Great Britain from 2016 to 2018.
More Information
United Kingdom
Nov 21, 2018
This chart shows public opinion on the likely outcome of a second Brexit referendum in 2018.
More Information
Air Pollution
Nov 21, 2018
This chart shows the average life expectancy lost per person worldwide due to the following.
More Information
Retail
Nov 21, 2018
This chart presents key figures about Black Friday in the United Kingdom.
More Information
New Survey
Nov 20, 2018
This chart shows the professions which are most and least trusted to tell the truth in the UK in 2018.
More Information
United Kingdom
Nov 19, 2018
This chart shows the issues that UK survey respondents were most worried about in September 2018.
More Information
Politics
Nov 16, 2018
This chart shows the level of support for the draft Brexit agreement as of 15 November 2018.
More Information
United Kingdom
Nov 15, 2018
This chart shows selected results of an October 2018 'Brexit Policy Panel' survey.
More Information
United Kingdom
Nov 13, 2018
This chart shows the politicians/political figures in the UK of which the most people have a favourable view in 2018.
More Information
Equal Pay Day
Nov 12, 2018
This chart shows a timeline of the gender pay gap for median gross hourly earnings of full-time employees in the UK.
More Information
Politics
Nov 9, 2018
This chart shows British attitudes towards military conscription in 2018.
More Information
Weather
Nov 2, 2018
This chart presents a comparison of annual averages for key meteorological indicators in the United Kingdom from 1961 to 2017.
More Information
Halloween
Oct 31, 2018
This chart shows how respondents would most likely act towards trick-or-treaters.
More Information
Cyberbullying
Oct 30, 2018
This chart shows the share of parents who say their child has experienced cyberbullying.
More Information
Employment
Oct 26, 2018
This chart shows the gender pay gap for median gross hourly earnings of full-time employees in the UK, by age group.
More Information
Gender
Oct 25, 2018
Share of adults that cook and/or do housework in selected European countries, by gender in 2016.
More Information
United Kingdom
Oct 24, 2018
This chart shows how likely people in the UK feel a second referendum on the country's EU membership is.
More Information
Defense
Oct 22, 2018
This chart shows the value of arms imported to Saudi Arabia between 2015 and 2017, by origin country.
More Information
Tech
Oct 19, 2018
This chart shows how frequently people in the UK use their smartphones during certain situations in 2018.
More Information
Smartphones
Oct 15, 2018
This chart shows the most downloaded iPhone apps in the UK in April 2019.
More Information
Brexit
Oct 15, 2018
This chart shows the planned stages of Brexit from October 2018 to 2020.
More Information
Digital Content
Oct 12, 2018
This chart shows how many consumers in the UK and the US have paid for digital content across several categories.
More Information
Poverty
Oct 12, 2018
This chart shows what UK households have done in response to high/unaffordable food prices as of 2018.
More Information
United Kingdom
Oct 11, 2018
This chart shows the results of a survey in Northern Ireland into whether people think Brexit would be worth risking the peace process.
More Information
Electric Cars
Oct 9, 2018
This chart shows the number of electric vehicle charging points per 100km of paved road.
More Information
Yemen Civil War
Oct 8, 2018
This chart shows the percent change in civilian deaths from the Yemen civil war between June and August 2018.
More Information
Technology
Oct 8, 2018
This chart shows the smartphones with the highest market share in selected countries in July 2018.
More Information
Statista Consumer Market Outlook
Oct 5, 2018
This chart shows the estimated annual per capita toilet paper consumption in selected countries in 2018.
More Information
Vacation
Oct 5, 2018
This chart shows the share of workers agreeing that they will use up all the vacation days they are given (2018).
More Information
Oct 4, 2018
This chart shows the result of a British survey question asking "Who would be your choice to play the next James Bond?". Landing...
More Information
UK Politics
Oct 1, 2018
This chart shows responses in the UK to the question "Do you agree or disagree that the following has what it takes to be a good prime...
More Information
Brands
Oct 1, 2018
This chart shows the brands that the largest share of 18-34 year olds have heard positive things about in 2018.
More Information
Toyota
Sep 28, 2018
This chart shows the countries where Toyota was the leading car manufacturer in 2017.
More Information
Global Tourism
Sep 27, 2018
This chart shows the top landmarks based on number of Instagram hashtags received in September 2018.
More Information
Armed Forces Personnel
Sep 27, 2018
This chart shows views in different countries on whether their armed forces personnel should be described as heroes.
More Information
GDPR
Sep 25, 2018
The chart shows the change of third-party domains and cookies per page (April - July 2018)
More Information
Journalism
Sep 25, 2018
This chart shows the number of journalists employed in Great Britain
More Information
STEM
Sep 20, 2018
This chart shows a distribution of scientists and engineers in the European Union, by location and a comparison so the country's share...
More Information
Refugees
Sep 20, 2018
This chart shows responses to the question: "would you oppose/support taking in refugees fleeing violence and war?"
More Information
Marathon Record
Sep 19, 2018
This chart shows the world record marathon progression for men.
More Information
United Kingdom
Sep 19, 2018
This chart shows the occupations of graduates aged 22 to 29 in the UK (2017).
More Information
United Kingdom
Sep 19, 2018
This chart shows the occupations of non-graduates aged 22 to 29 in the UK (2017).
More Information
Satellites
Sep 19, 2018
This chart shows the number of domestic and foreign satellites launches in India.
More Information
United Kingdom
Sep 19, 2018
This chart shows how people living outside and in London see Londoners.
More Information
Football
Sep 18, 2018
This chart shows the players available for selection in the 2018/19 Champions League with the highest transfer value.
More Information
15
/
25
Contact
Get in touch with us. We are happy to help.
Do you still have questions?
Feel free to contact us anytime using our
contact form
or visit our
FAQ page
.
Your contact to the Infographics Newsroom
Felix Richter
Data Journalist
felix.richter@statista.com
+49 (40) 284 841 557