Skip to main content
Consumer Goods & FMCG
E-Commerce
Economy & Politics
Energy & Environment
Health, Pharma & Medtech
Internet
Media
Technology & Telecommunications
Transportation & Logistics
Travel, Tourism & Hospitality
View all industries
Global data volume growth
Global AI market size
Number of generative AI users worldwide
Global inflation rate
Retail e-commerce sales worldwide
Largest economies worldwide
Biggest social media platforms by users
Global EV market share by manufacturer
International tourist arrivals by world region
Global annual CO₂ emissions
Browse recent statistics
Artificial intelligence (AI) worldwide
TikTok
Nvidia
E-commerce worldwide
Global GDP
Instagram
Apparel market worldwide
Video gaming worldwide
Global renewable energy industry
Influencer marketing worldwide
Browse recent topics
Consumer Trends 2026
Artificial Intelligence: in-depth market analysis
E-commerce challenges
Global economy
TikTok
Luxury goods: in-depth market analysis
Electric vehicles: A global overview
Video gaming worldwide
Travel and tourism trends 2026
Battery recycling worldwide
Browse recent reports
Explore the tool
Explore Classic mode
Advertising & Media
eCommerce
Consumer
Finance
Global Indicators
Health
Industrial
Mobility
Technology
Explore Market Insights
eCommerce Insights
Research AI
Book a demo
All integrations
Developer docs
Explore Statista Connect
Research
Strategy & Consulting
Marketing
Media & PR
Explore AI assistants
Marketing
Research & Development
Strategy
Sales
Find the fact
Tell the story
Win the pitch
Understand the market
Develop your strategy
Academia
Agencies
Consultancies
Consumer goods
Finance
Tech
Research solutions
Strategy consulting
Communication services
Explore Statista+
Statista R
Statista Healthcare
About Statista
First steps & help center
Webinar & training hub
Success stories
Individuals & Small Teams
Businesses & Enterprises
Academia & Government
English
Deutsch
Daily Data
Infographics on the topic "uk"
Eurovision
May 17, 2019
This chart shows responses to the question: "if there was a referendum on the UK's Eurovision membership, how would you vote?"
More Information
Padel
May 17, 2019
This chart shows key facts about the growth of padel around the world.
More Information
Meat Industry
May 16, 2019
This chart shows the number of livestock slaughtered as meat for human consumption in the UK in April 2019.
More Information
Plastic
May 15, 2019
This chart presents figures related to the packaging waste created by British workers' 'lunches on the go' in 2019.
More Information
May 14, 2019
This chart shows the top 10 business passwords in 2014.
More Information
Apps
May 14, 2019
This chart shows the total revenue of the biggest grossing Play Store apps in April 2019 in the UK.
More Information
UK Politics
May 13, 2019
This chart shows the share saying they think the parties in the UK will not be a political force in 10 years.
More Information
Alcohol Consumption
May 10, 2019
This chart shows the average annual liters of alcohol consumed per person in 2017 and % change on 2010.
More Information
Wealthiest Musicians
May 9, 2019
This chart shows the estimated wealth of musical performers in the UK and Ireland in 2019.
More Information
e-Mobility
May 8, 2019
This chart reveals the changes it would take to make UK motorists buy an electric vehicle.
More Information
Mobility
May 8, 2019
This chart shows the average weekly pump price of unleaded petrol and diesel in the UK in 2018/19.
More Information
Tech
May 7, 2019
This chart shows the most downloaded apps from the Play Store in April 2019 in the UK.
More Information
Royal Family
May 7, 2019
This chart illustrates the economic effect of royal babies in the UK.
More Information
Nightlife
May 6, 2019
This charts shows the average cost of a night out in European cities in 2019.
More Information
Brexit
May 3, 2019
This chart shows the number of applications under the EU Settlement Scheme by nationality.
More Information
New Survey
Apr 29, 2019
This chart shows the share of UK adults saying they think certain science-based conspiracy theories are true in 2019.
More Information
Most Indebted Countries
Apr 29, 2019
This chart shows the countries with the highest government debt as a percentage of GDP in 2017.
More Information
Health
Apr 26, 2019
This chart shows cancer incidence rates per 100,000 population in England in 2017, by region.
More Information
Politics
Apr 26, 2019
This chart shows the share of Britons aware of the following in 2019.
More Information
Health
Apr 25, 2019
This chart shows high-income countries where the most children received no first measles vaccine from 2010 to 2017.
More Information
National savings
Apr 24, 2019
This chart shows net borrowing and lending in selected OECD countries.
More Information
Passwords
Apr 23, 2019
This chart shows the most commonly re-occurring teams used as passwords in cyber breaches in 2019
More Information
Passwords
Apr 23, 2019
This chart shows the most commonly re-occurring passwords in cyber breaches in 2019.
More Information
Easter Eggs
Apr 18, 2019
This chart shows the number of teaspoons of sugar in popular Easter eggs sold in the UK & Ireland in 2019.
More Information
ePublishing
Apr 16, 2019
This chart shows the revenue forecast and growth rate (in billion USD) for ePublishing in selected countries.
More Information
Crime
Apr 12, 2019
This chart shows the total cost to insurers of vehicle thefts in the UK in 2018 and compared to 2017.
More Information
Brexit
Apr 11, 2019
This chart illustrates the costs for the UK related to the 2014 European Parliamentary elections.
More Information
Brexit
Apr 11, 2019
This chart shows the share of respondents with the following views about Brexit.
More Information
National Sibling Day
Apr 10, 2019
This chart shows the percent of respondents who compared their humor to their sibling(s).
More Information
Brexit
Apr 9, 2019
This chart shows the share saying the UK's political system needs 'a great deal' of improvement from 2004 to 2019.
More Information
Beach Resorts
Apr 8, 2019
This chart shows the average cost of nine tourist staples in European beach resorts in 2019.
More Information
European Union
Apr 8, 2019
This chart shows harvested potato production and share of EU-2018 total in 2015.
More Information
UK Politics
Apr 8, 2019
This chart shows how Labour and Conservative voters from 2017 would vote in a new election in 2019.
More Information
UK Politics
Apr 4, 2019
This chart shows the results of a survey into what the British public think should happen in the next stage of the Brexit process (April...
More Information
Northern Ireland
Apr 4, 2019
This chart shows how respondents in the UK feel about Northern Ireland holding a referendum on its future.
More Information
Employment
Apr 2, 2019
This infographic charts the National Minimum/Living Wage in the United Kingdom from 1999 to 2019.
More Information
Hospitality
Apr 2, 2019
This chart shows the average spend on a night out in the UK, by city in 2019.
More Information
UK Politics
Apr 2, 2019
This chart shows the results of votes on alternative Brexit proposals on 1 April 2019.
More Information
UK Politics
Apr 1, 2019
This chart shows the basic salary of Members of Parliament in the UK from 1996 to 2019.
More Information
England/Wales
Apr 1, 2019
This chart shows the ratio of average house prices to residents' average annual earnings in 2018, by least affordable local authority...
More Information
United Kingdom
Mar 28, 2019
This chart shows the Conservative MPs of which the most people in the UK have a favourable view in 2019.
More Information
Marijuana
Mar 27, 2019
This chart shows estimated 2018 tax revenue in states where recreational marijuana use is legal.
More Information
Automation
Mar 27, 2019
This chart shows the share of jobs with the highest and lowest risk from automation in England in 2017.
More Information
Brexit
Mar 25, 2019
This chart shows the top-10 countries with the most signatures outside the UK.
More Information
International Students
Mar 21, 2019
This chart shows post-graduation tax revenues associated with international students in 2016/17.
More Information
Energy Mix
Mar 21, 2019
This chart shows primary energy consumption in the U.S., the UK, Australia and Canada.
More Information
Immigration
Mar 15, 2019
This chart shows the opinion of citizens in 18 immigration countries about newcomers to those countries.
More Information
Comic Relief
Mar 14, 2019
This chart shows the total amount raised by Red Nose Day in the UK from 2001 to 2017.
More Information
Brexit
Mar 13, 2019
This chart presents selected forecasts related to the impact of the UK exiting the EU without a deal.
More Information
United Kingdom
Mar 11, 2019
Stated reasons people are 'quite' or 'very' dissatisfied with the NHS in 2019.
More Information
Retail
Mar 11, 2019
This chart shows the share of point of sale purchases using cash by households in selected European countries.
More Information
Advertising
Mar 8, 2019
This chart shows that net advertising spending in the United Kingdom (UK) from 2005 to 2019 in millions of pounds.
More Information
Female Representation
Mar 8, 2019
This chart shows the number of public statues depicting men and women in the U.S. and the U.K.
More Information
Female Managers
Mar 8, 2019
This chart shows the share of female senior executives and managers in EU countries.
More Information
Tinder revenue
Mar 8, 2019
This chart shows the net revenue of the Tinder app on the Apple App Store and Google Play Store in 2018 in different European countries.
More Information
Gender Inequality
Mar 7, 2019
This chart shows index scores for female economic empowerment in OECD countries in 2017 (100=highest).
More Information
Health
Mar 6, 2019
This chart shows the share of children in the UK that have received one dose of the MMR vaccine, by region.
More Information
England/Wales
Mar 6, 2019
This chart shows the annual change in selected violent offences involving a knife/sharp instrument in England and Wales.
More Information
United Kingdom
Mar 1, 2019
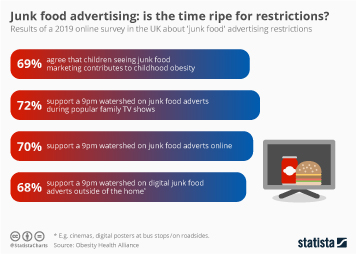
This chart shows the results of a 2019 online survey in the UK about 'junk food' advertising restrictions.
More Information
Food
Feb 28, 2019
This chart shows the estimated number of eggs eaten in the UK from 2004 to 2018.
More Information
Health
Feb 28, 2019
This chart shows the breakfast cereal products with the most sugar per 100g in the United Kingdom in November 2018.
More Information
E-Waste
Feb 28, 2019
This chart shows e-waste generated per inhabitant in selected countries in 2016 (kg).
More Information
Air Travel
Feb 26, 2019
This chart shows the EU airports which had the highest share of arrivals from the UK in 2017.
More Information
United Kingdom
Feb 25, 2019
This chart shows the number of identified deaths of homeless people per 100,000 population, by deprivation decile from 2013 to 2017.
More Information
Air Travel
Feb 25, 2019
This chart shows the busiest UK airports by number of terminal passengers in 2018.
More Information
UK Citizenship
Feb 20, 2019
This chart shows the number UK citizenship revocations 'conducive to the public good' from 2014 to 2017.
More Information
Demographics
Feb 19, 2019
This chart shows the average age at which people in the UK have reached certain life milestones.
More Information
Poaching
Feb 19, 2019
This chart shows descriptive statistics regarding elephant poaching.
More Information
Manufacturing
Feb 19, 2019
This chart presents key figures related to the presence of Honda in the UK in 2018.
More Information
New Survey
Feb 18, 2019
This chart shows the average expected age at which UK teenagers expect to have achieved certain life milestones.
More Information
Education
Feb 15, 2019
This chart shows the difference in earnings 5 years after graduation compared to avg. degree in England, by subject.
More Information
Education
Feb 15, 2019
This chart shows the difference in earnings 5 years after graduation compared to avg. degree in England, by subject.
More Information
Technology
Feb 14, 2019
This chart details survey results on video viewing habits in the United Kingdom in 2018.
More Information
Brexit
Feb 13, 2019
This chart shows the estimated number of jobs threatened per country in the case of a hard Brexit.
More Information
Technology
Feb 12, 2019
This chart shows the share of people that used the following streaming/downloading services in the UK in 2018.
More Information
Economy
Feb 11, 2019
This chart shows year on year three-month growth rate of the UK manufacturing sector in 2018.
More Information
'Global Britain'
Feb 11, 2019
This chart shows official development assistance (ODA) spending in the UK from 2013 to 2017 and the main recipients.
More Information
Social Media Advertising
Feb 5, 2019
This chart shows the social media advertising revenue in selected countries in Europe in 2018 (in million U.S. dollars).
More Information
Airlines
Feb 4, 2019
This chart shows the quarterly profit/loss of Ryanair Holdings plc and Subsidiaries in FY2019.
More Information
Public Opinion
Feb 1, 2019
This chart shows statistics on American perceptions of the U.S. and UK political situation.
More Information
Six Nations
Feb 1, 2019
This chart shows players who have scored at least 250 points in the Five/Six Nations.
More Information
Six Nations
Feb 1, 2019
This chart shows the players with the most tries in the Five/Six Nations.
More Information
Brexit
Feb 1, 2019
This chart shows how many UK companies have indicated that they want to move because of Brexit.
More Information
UK Prison System
Jan 31, 2019
This chart shows the number of incidents of self-harm in prisons in England and Wales.
More Information
New Study
Jan 28, 2019
This chart shows the Great British cities with the largest decreases in local authority services spending from 09/10 to 17/18.
More Information
Brexit
Jan 25, 2019
This chart presents key figures related to Airbus operations in the United Kingdom in 2018.
More Information
Brexit
Jan 24, 2019
This chart shows the number of car and HGV crossings in 2017.
More Information
United Kingdom
Jan 24, 2019
This chart shows survey responses to the question: "Which of the following steps, if any, do you think the Prime Minister should now...
More Information
Health
Jan 24, 2019
This chart shows the number of abortions in Northern Ireland and the number carried out for Northern Irish women in England and Wales.
More Information
EU Army
Jan 24, 2019
This chart shows the percentage of respondents who support the creation of an EU army (2017).
More Information
14
/
25
Contact
Get in touch with us. We are happy to help.
Do you still have questions?
Feel free to contact us anytime using our
contact form
or visit our
FAQ page
.
Your contact to the Infographics Newsroom
Felix Richter
Data Journalist
felix.richter@statista.com
+49 (40) 284 841 557