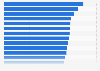
This statistic displays the findings of a survey on the frequency of negative interactions on social networking sites and messaging apps in Great Britain (GB) as of January 2015, by age group. During the survey period, it was found that 33 percent of respondents aged between 18 and 24 years reported that such interactions occurred occasionally.
Frequency of negative interactions on social networking sites and messaging apps according to users in Great Britain (GB) as of January 2015, by age group*
Basic Account
Get to know the platform
You only have access to basic statistics.
This statistic is not included in your account.
Starter Account
The ideal entry-level account for individual users
- Instant access to 1m statistics
- Download in XLS, PDF & PNG format
- Detailed references
$229 USD $199 USD / Month *
in the first 12 months
Professional Account
Full access
Business Solutions including all features.
* Prices do not include sales tax.
Other statistics that may interest you Statistics on
About the industry
9
- Premium Statistic Tumblr usage purposes in Finland 2019
- Premium Statistic Snapchat usage purposes in Finland 2019
- Premium Statistic WhatsApp usage purposes in Finland 2019
- Premium Statistic Pinterest usage purposes in Finland 2019
- Premium Statistic Leading five social media and messaging apps in Italy 2017
- Basic Statistic U.S. registered WhatsApp user reach 2022, by gender
- Basic Statistic U.S. registered WhatsApp user reach 2022, by age group
- Basic Statistic U.S. registered WhatsApp user reach 2022, by urbanity
- Basic Statistic Social media: distribution of South African audiences 2023, by age and gender
About the region
10
- Premium Statistic Reach of selected social networking websites in the Great Britain 2014-2020
- Premium Statistic Distribution of Twitter users in Great Britain (GB) 2013-2016, by age group
- Premium Statistic Leading social media apps in Great Britain 2022, by downloads
- Basic Statistic Social networking penetration in Great Britain 2011-2020
- Premium Statistic Monthly downloads of the Tinder app on Google Play in Great Britain 2019-2020
- Premium Statistic Monthly downloads of the Twitter app on Google Play in Great Britain 2019-2020
- Premium Statistic Leading news and magazines apps in Google Play in Great Britain 2019-20, by downloads
- Premium Statistic Monthly downloads of the Pinterest app to iPhones in Great Britain 2019-2020
- Premium Statistic Monthly downloads of the Netflix app to iPhones in Great Britain 2019-2020
- Premium Statistic Monthly downloads of the Headspace app on Google Play in Great Britain 2019-2020
Other regions
10
- Premium Statistic Most used social media among individuals aged 36 to 45 in Finland 2020
- Premium Statistic Instagram users in Norway as of Q4 2022, by age group and gender
- Premium Statistic Countries with the most LinkedIn users 2023
- Premium Statistic Ranking of mainly used social networks among French aged 16-25 years old 2021
- Basic Statistic United States: leading messenger app penetration 2020
- Premium Statistic Italy: opinions about social networks among women 2018 by age group
- Basic Statistic Share of WhatsApp users in the United Kingdom (UK) 2018, by age group
- Premium Statistic Spain: favorite social media networks 2018-2023
- Premium Statistic Latvia: Facebook usage penetration 2018-2027
- Premium Statistic Facebook usage penetration in Turkey 2018-2027
Related statistics
9
- Premium Statistic YouTube user reach in Norway Q4 2022, by age group and gender
- Premium Statistic Distribution of WhatsApp users in the United Kingdom Q1 2020, by frequency of use
- Premium Statistic YouTube usage in Sweden 2019, by device
- Premium Statistic WhatsApp usage in Sweden 2019, by device
- Premium Statistic YouTube usage in Norway 2019, by device
- Premium Statistic YouTube usage in Finland 2019, by device
- Premium Statistic WhatsApp usage in Norway 2019, by device
- Premium Statistic WhatsApp usage in Finland 2019, by device
- Basic Statistic U.S. registered WhatsApp user reach 2022, by household income
Further related statistics
10
- Social network usage for news access worldwide 2019-2023
- Social network profile creation in the UK 2010-2020, by socio-economic group
- Computer software: Online purchasing in Great Britain 2020, by age group
- Mobile internet use via laptops in Great Britain 2019, by demographic
- User numbers of microblogs in China 2010-2018
- Reading frequency of book consumers in France 2017, by age
- Leading trends in technology in restaurants in the U.S. 2015*
- Current alcohol use in persons aged 12-20 in the U.S. by age 2002-2013
- Percentage of U.S. adults with alcohol problems receiving treatment 2008-2011
- Reasons for using social media to get a customer service response 2012
Further Content: You might find this interesting as well
Statistics
- Social network usage for news access worldwide 2019-2023
- Social network profile creation in the UK 2010-2020, by socio-economic group
- Computer software: Online purchasing in Great Britain 2020, by age group
- Mobile internet use via laptops in Great Britain 2019, by demographic
- User numbers of microblogs in China 2010-2018
- Reading frequency of book consumers in France 2017, by age
- Leading trends in technology in restaurants in the U.S. 2015*
- Current alcohol use in persons aged 12-20 in the U.S. by age 2002-2013
- Percentage of U.S. adults with alcohol problems receiving treatment 2008-2011
- Reasons for using social media to get a customer service response 2012
ComRes. (February 10, 2015). Frequency of negative interactions on social networking sites and messaging apps according to users in Great Britain (GB) as of January 2015, by age group* [Graph]. In Statista. Retrieved October 04, 2023, from https://www.statista.com/statistics/505127/gb-negative-interactions-on-social-networks-and-messaging-apps-by-age-group/
ComRes. "Frequency of negative interactions on social networking sites and messaging apps according to users in Great Britain (GB) as of January 2015, by age group*." Chart. February 10, 2015. Statista. Accessed October 04, 2023. https://www.statista.com/statistics/505127/gb-negative-interactions-on-social-networks-and-messaging-apps-by-age-group/
ComRes. (2015). Frequency of negative interactions on social networking sites and messaging apps according to users in Great Britain (GB) as of January 2015, by age group*. Statista. Statista Inc.. Accessed: October 04, 2023. https://www.statista.com/statistics/505127/gb-negative-interactions-on-social-networks-and-messaging-apps-by-age-group/
ComRes. "Frequency of Negative Interactions on Social Networking Sites and Messaging Apps According to Users in Great Britain (Gb) as of January 2015, by Age Group*." Statista, Statista Inc., 10 Feb 2015, https://www.statista.com/statistics/505127/gb-negative-interactions-on-social-networks-and-messaging-apps-by-age-group/
ComRes, Frequency of negative interactions on social networking sites and messaging apps according to users in Great Britain (GB) as of January 2015, by age group* Statista, https://www.statista.com/statistics/505127/gb-negative-interactions-on-social-networks-and-messaging-apps-by-age-group/ (last visited October 04, 2023)
Frequency of negative interactions on social networking sites and messaging apps according to users in Great Britain (GB) as of January 2015, by age group* [Graph], ComRes, February 10, 2015. [Online]. Available: https://www.statista.com/statistics/505127/gb-negative-interactions-on-social-networks-and-messaging-apps-by-age-group/