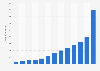
This statistic presents information on preference of Instagram and Snapchat Stories among users in the United States as of August 2016, sorted by age group. During the survey, 36 percent of respondents aged 18 to 34 years stated that they would much rather use Snapchat Stories.
Social media user preference of Snapchat Stories and Instagram stories in the United States as of August 2016, by age group
Characteristic
18-34
35-54
55+
-
-
-
-
-
-
-
-
-
-
-
-
-
-
-
-
-
-
-
-
Exclusive Premium Statistic
To access all Premium Statistics, you need a paid Statista Account
Profit from the additional features of your individual account
Currently, you are using a shared account. To use individual functions (e.g., mark statistics as favourites, set
statistic alerts) please log in with your personal account.
If you are an admin, please authenticate by logging in again.
Learn more about how Statista can support your business.
YouGov. (September 8, 2016). Social media user preference of Snapchat Stories and Instagram stories in the United States as of August 2016, by age group [Graph]. In Statista. Retrieved July 27, 2024, from https://www.statista.com/statistics/612823/snapchat-instagram-stories-preference-us-age-group/
YouGov. "Social media user preference of Snapchat Stories and Instagram stories in the United States as of August 2016, by age group." Chart. September 8, 2016. Statista. Accessed July 27, 2024. https://www.statista.com/statistics/612823/snapchat-instagram-stories-preference-us-age-group/
YouGov. (2016). Social media user preference of Snapchat Stories and Instagram stories in the United States as of August 2016, by age group. Statista. Statista Inc.. Accessed: July 27, 2024. https://www.statista.com/statistics/612823/snapchat-instagram-stories-preference-us-age-group/
YouGov. "Social Media User Preference of Snapchat Stories and Instagram Stories in The United States as of August 2016, by Age Group." Statista, Statista Inc., 8 Sep 2016, https://www.statista.com/statistics/612823/snapchat-instagram-stories-preference-us-age-group/
YouGov, Social media user preference of Snapchat Stories and Instagram stories in the United States as of August 2016, by age group Statista, https://www.statista.com/statistics/612823/snapchat-instagram-stories-preference-us-age-group/ (last visited July 27, 2024)
Social media user preference of Snapchat Stories and Instagram stories in the United States as of August 2016, by age group [Graph], YouGov, September 8, 2016. [Online]. Available: https://www.statista.com/statistics/612823/snapchat-instagram-stories-preference-us-age-group/