Skip to main content
Consumer Goods & FMCG
E-Commerce
Economy & Politics
Energy & Environment
Health, Pharma & Medtech
Internet
Media
Technology & Telecommunications
Transportation & Logistics
Travel, Tourism & Hospitality
View all industries
Global data volume growth
Global AI market size
Number of generative AI users worldwide
Global inflation rate
Retail e-commerce sales worldwide
Largest economies worldwide
Biggest social media platforms by users
Global EV market share by manufacturer
International tourist arrivals by world region
Global annual CO₂ emissions
Browse recent statistics
Artificial intelligence (AI) worldwide
TikTok
Nvidia
E-commerce worldwide
Global GDP
Instagram
Apparel market worldwide
Video gaming worldwide
Global renewable energy industry
Influencer marketing worldwide
Browse recent topics
Consumer Trends 2026
Artificial Intelligence: in-depth market analysis
E-commerce challenges
Global economy
TikTok
Luxury goods: in-depth market analysis
Electric vehicles: A global overview
Video gaming worldwide
Travel and tourism trends 2026
Battery recycling worldwide
Browse recent reports
Explore the tool
Explore Classic mode
Advertising & Media
eCommerce
Consumer
Finance
Global Indicators
Health
Industrial
Mobility
Technology
Explore Market Insights
eCommerce Insights
Research AI
Book a demo
All integrations
Developer docs
Explore Statista Connect
Research
Strategy & Consulting
Marketing
Media & PR
Explore AI assistants
Marketing
Research & Development
Strategy
Sales
Find the fact
Tell the story
Win the pitch
Understand the market
Develop your strategy
Academia
Agencies
Consultancies
Consumer goods
Finance
Tech
Research solutions
Strategy consulting
Communication services
Explore Statista+
Statista R
Statista Healthcare
About Statista
First steps & help center
Webinar & training hub
Success stories
Individuals & Small Teams
Businesses & Enterprises
Academia & Government
English
Deutsch
Daily Data
Infographics on the topic "+"
Media Consumption
Apr 17, 2019
This chart shows the medium that voters are most likely to first learn about political candidates/issues
More Information
Parents Online
Apr 17, 2019
This chart shows the percent of respondents who engage in select digital activities after putting kids to sleep.
More Information
Apr 17, 2019
This chart shows EU chocolate production in 2017 (million tonnes).
More Information
Statista Digital Economy Compass
Apr 17, 2019
This chart shows total worldwide venture capital invested in blockchain companies from 2013 to 2018.
More Information
Measles
Apr 17, 2019
This chart shows countries by number of confirmed measles cases from January to April.
More Information
ePublishing
Apr 16, 2019
This chart shows the revenue forecast and growth rate (in billion USD) for ePublishing in selected countries.
More Information
Pay-TV
Apr 16, 2019
This chart shows the number of subscribers of the largest Pay-TV providers in the United States at the end of Q4 2018.
More Information
Statista Digital Economy Compass
Apr 16, 2019
This chart shows the actual and forecast amount of data created worldwide from 2010 to 2035.
More Information
Statista Digital Economy Compass
Apr 16, 2019
This chart shows selected capacity comparisons for the amount of data created worldwide in 2018.
More Information
Pay-TV
Apr 16, 2019
This chart shows net subscriber loss of the largest pay-TV providers in the United States.
More Information
Facebook
Apr 16, 2019
This chart shows Facebook's security spending for Mark Zuckerberg and his family by year.
More Information
Notre Dame Fire
Apr 16, 2019
This chart shows some of the key figures behind the Notre Dame Cathedral.
More Information
Health
Apr 16, 2019
This chart shows the countries with the highest increases in measles cases from 2017 to 2018.
More Information
Stratolaunch
Apr 15, 2019
This chart shows ten of the world's largest aircraft by wingspan in feet.
More Information
Tax Refunds
Apr 15, 2019
This chart shows how Americans that expect a tax refund this year plan to spend the money.
More Information
Europe's Middle Class Under Pressure
Apr 15, 2019
This infographic presents the share of middle-income households having difficulties to make ends meet in Europe in 2017.
More Information
Tiger Woods
Apr 15, 2019
This chart shows Tiger Woods' major championship titles.
More Information
Income Tax
Apr 15, 2019
This chart shows the average share of gross wages paid in tax/social security contributions in 2018.
More Information
2020 Elections
Apr 12, 2019
This chart shows contributions to Democratic candidates and cases through the ActBlue platform.
More Information
College Sports
Apr 12, 2019
This chart shows the most valuable NCAA teams, in football and basketball.
More Information
Crime
Apr 12, 2019
This chart shows the total cost to insurers of vehicle thefts in the UK in 2018 and compared to 2017.
More Information
Uber IPO
Apr 12, 2019
This chart shows Uber's revenue, costs and expenses and cumulative operating losses since 2014.
More Information
Vinyl Sales in the U.S.
Apr 12, 2019
This chart ranks the best-selling artists in the U.S. by number of vinyl albums sold in 2018.
More Information
Coup Attempts
Apr 12, 2019
This chart shows the number of successul/unsuccessful coup attempts from 1946 to 2019.
More Information
Car Sales
Apr 12, 2019
This chart shows types and models of cars sold most in Australia in 2018.
More Information
Tech Use
Apr 11, 2019
This chart shows the percent of U.S. adults who say they use the following online platforms or messaging apps, between 2012 and 2019.
More Information
Favorite Brands of American Teens
Apr 11, 2019
The chart show U.S. teenagers' favorite apparel and ootwear brands as of spring 2019.
More Information
Global Growth
Apr 11, 2019
This chart shows global GDP growth from 2010 to 2023 by region.
More Information
Brexit
Apr 11, 2019
This chart illustrates the costs for the UK related to the 2014 European Parliamentary elections.
More Information
Brexit
Apr 11, 2019
This chart shows the share of respondents with the following views about Brexit.
More Information
Asthma
Apr 11, 2019
This chart shows the incidence rate of childhood asthma due to traffic pollution (per 100,000 children per year).
More Information
Small Business Owners
Apr 10, 2019
This chart shows the U.S. small business owners' assessment of their biggest challenge in 2019.
More Information
Population Density
Apr 10, 2019
This chart show the ratio of national population to land area in people per square kilometers by select countries for 2017.
More Information
National Sibling Day
Apr 10, 2019
This chart shows the percent of respondents who compared their humor to their sibling(s).
More Information
Social media
Apr 10, 2019
This chart ranks the favorite social networking platforms of U.S. teens.
More Information
Caves
Apr 10, 2019
This chart shows the longest caves in the world.
More Information
Iran
Apr 10, 2019
This chart shows the number of cars and commercial vehicles produced in Iran (2013-2018)
More Information
U.S. Air Force
Apr 10, 2019
Estimated total cost of training a basic qualified pilot by platform in 2018.
More Information
Cashless Payments
Apr 9, 2019
This chart shows the share of respondents that support or do not support a cashless society.
More Information
Women in Politics
Apr 9, 2019
This chart shows the percent of GOP members in the House who are women, or named John/Mike.
More Information
Social networks
Apr 9, 2019
This chart shows the number of people with LinkedIn worldwide, by country (in millions).
More Information
Foreign Investment
Apr 9, 2019
This chart shows outward direct investment from China to Australia from 2007 until 2018.
More Information
Germany
Apr 9, 2019
This chart shows the total rent of a room in a shared flat for the 2019 summer semester in Germany.
More Information
Alcohol Consumption
Apr 9, 2019
This chart shows the percent change in U.S. alcohol consumption by type.
More Information
German Tax System
Apr 9, 2019
This chart shows the number of tax returns submitted electronically in Germany (millions).
More Information
Tech Trust
Apr 9, 2019
This chart shows the share of respondents who do not trust select organizations with their personal information.
More Information
Survey
Apr 9, 2019
This chart shows the share of Russians that say that If they had the opportunity, they would you like to move permanently to another...
More Information
Brexit
Apr 9, 2019
This chart shows the share saying the UK's political system needs 'a great deal' of improvement from 2004 to 2019.
More Information
Apr 9, 2019
This chart shows remittances sent by immigrants living in the U.S. to their home countries in 2017.
More Information
Election Security
Apr 8, 2019
This chart shows the share of reported states spending for the administration of federal elections
More Information
Lok Sabha
Apr 8, 2019
This chart shows rural Indians trust in forwarded WhatsApp messages as well as the make up of messages on WhatsApp in India.
More Information
Pinterest IPO
Apr 8, 2019
This chart compares Pinterest's pre-IPO performance to Snap's and Twitter's in terms of revenue, net loss and active user base.
More Information
Video Game Consoles
Apr 8, 2019
This chart shows lifetime sales of the best-selling home video game consoles of all time.
More Information
European Union
Apr 8, 2019
This chart shows the share of the population rating their health as good or very good in 2017.
More Information
Beach Resorts
Apr 8, 2019
This chart shows the average cost of nine tourist staples in European beach resorts in 2019.
More Information
European Union
Apr 8, 2019
This chart shows harvested potato production and share of EU-2018 total in 2015.
More Information
UK Politics
Apr 8, 2019
This chart shows how Labour and Conservative voters from 2017 would vote in a new election in 2019.
More Information
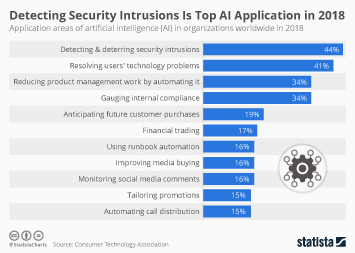
Artificial Intelligence
Apr 5, 2019
This chart shows the application areas of artificial intelligence (AI) in organizations worldwide in 2018.
More Information
Vegetable Consumption
Apr 5, 2019
This chart shows the share of the population who ate vegetables at least once a day in 2017.
More Information
Retail sales in the United States
Apr 5, 2019
This chart compares nonstore retail sales to general merchandise store and grocery store sales in the United States.
More Information
Craft Beer
Apr 5, 2019
This chart shows the market share of small and independent brewers in the U.S. by year.
More Information
Divorces
Apr 5, 2019
This chart shows the estimated value of the ten most expensive divorces.
More Information
E-Health
Apr 4, 2019
This chart shows the amount of money raised and the number of fundraising deals by health start-ups, worldwide.
More Information
Virtual Digital Assistants
Apr 4, 2019
This chart shows the enterprise virtual digital assistant market size worldwide between 2016 and 2025.
More Information
eSports
Apr 4, 2019
This chart shows how the announced $100 million prize pool for Fortnite competitions compares to historical prize money for other major...
More Information
Game Of Thrones
Apr 4, 2019
This chart shows the number of deaths by "Game of Thrones" season as of April 2019.
More Information
Valuable Airlines
Apr 4, 2019
This chart shows the most valuable airline brands in the world in 2019, as ranked by Brand Finance.
More Information
National Burrito Day
Apr 4, 2019
This chart shows the best-selling burrito and Tex-Mex restaurants in the U.S.
More Information
UK Politics
Apr 4, 2019
This chart shows the results of a survey into what the British public think should happen in the next stage of the Brexit process (April...
More Information
Germany
Apr 4, 2019
This chart shows the number of social apartments per 1,000 inhabitants by federal state in 2015.
More Information
Berlin
Apr 4, 2019
This chart shows housing costs as a share of purchasing power in Berlin by district (2013 & 2016).
More Information
Health
Apr 4, 2019
This chart shows the share of adult deaths attributable to dietary risks in 2017, by region.
More Information
Northern Ireland
Apr 4, 2019
This chart shows how respondents in the UK feel about Northern Ireland holding a referendum on its future.
More Information
News Subscriptions
Apr 3, 2019
This chart shows the news publishers with the highest number of digital-only subscribers (in million).
More Information
Game of Thrones
Apr 3, 2019
This chart shows the share of GoT fans who said the following character will die in the final season.
More Information
Ridesharing
Apr 3, 2019
This chart shows the percent that identify the main reason that led a rider to choose Lyft/Uber over other options.
More Information
Tourism
Apr 3, 2019
This chart shows international visitors to South Korea in 2018 by month and indicated peak travelling times.
More Information
Music Consumption
Apr 3, 2019
This chart shows global record music revenues in 2008 and 2018, broken down by format.
More Information
Teacher Salaries
Apr 3, 2019
This chart shows the average change in teacher salary by state between 2002 and 2017.
More Information
Autism Awareness Day
Apr 2, 2019
This chart shows the prevalence of autism spectrum disorder in the U.S. from 2000 to 2014 (per 1,000 children).
More Information
Millionaire Taxpayers
Apr 2, 2019
This chart shows the number of Australian income millionaires paying no taxes as well as items claimed by Australian income milionaires...
More Information
Employability
Apr 2, 2019
This chart shows the coding skills and employability of Indian IT engineering graduates in 2019.
More Information
Employment
Apr 2, 2019
This infographic charts the National Minimum/Living Wage in the United Kingdom from 1999 to 2019.
More Information
Hospitality
Apr 2, 2019
This chart shows the average spend on a night out in the UK, by city in 2019.
More Information
Gmail turns 15
Apr 2, 2019
This chart shows the top 10 email clients worldwide based on the share of email opens in March 2019.
More Information
Tech IPOs
Apr 2, 2019
This chart shows how long it took for the share prices of tech companies to drop below their respective IPO price for the first time.
More Information
Turkey
Apr 2, 2019
This chart shows the number of provinces controlled by Turkish political parties after Sunday's election.
More Information
F-35 Program
Apr 2, 2019
This chart shows details about the Turkish companies supporting F-35 development.
More Information
Shopping
Apr 2, 2019
This chart shows the average annual amount spent while under the influence of alcohol by state in 2019.
More Information
UK Politics
Apr 2, 2019
This chart shows the results of votes on alternative Brexit proposals on 1 April 2019.
More Information
98
/
161
Contact
Get in touch with us. We are happy to help.
Do you still have questions?
Feel free to contact us anytime using our
contact form
or visit our
FAQ page
.
Your contact to the Infographics Newsroom
Felix Richter
Data Journalist
felix.richter@statista.com
+49 (40) 284 841 557