Skip to main content
Consumer Goods & FMCG
E-Commerce
Economy & Politics
Energy & Environment
Health, Pharma & Medtech
Internet
Media
Technology & Telecommunications
Transportation & Logistics
Travel, Tourism & Hospitality
View all industries
Global data volume growth
Global AI market size
Number of generative AI users worldwide
Global inflation rate
Retail e-commerce sales worldwide
Largest economies worldwide
Biggest social media platforms by users
Global EV market share by manufacturer
International tourist arrivals by world region
Global annual CO₂ emissions
Browse recent statistics
Artificial intelligence (AI) worldwide
TikTok
Nvidia
E-commerce worldwide
Global GDP
Instagram
Apparel market worldwide
Video gaming worldwide
Global renewable energy industry
Influencer marketing worldwide
Browse recent topics
Consumer Trends 2026
Artificial Intelligence: in-depth market analysis
E-commerce challenges
Global economy
TikTok
Luxury goods: in-depth market analysis
Electric vehicles: A global overview
Video gaming worldwide
Travel and tourism trends 2026
Battery recycling worldwide
Browse recent reports
Explore the tool
Explore Classic mode
Advertising & Media
eCommerce
Consumer
Finance
Global Indicators
Health
Industrial
Mobility
Technology
Explore Market Insights
eCommerce Insights
Research AI
Book a demo
All integrations
Developer docs
Explore Statista Connect
Research
Strategy & Consulting
Marketing
Media & PR
Explore AI assistants
Marketing
Research & Development
Strategy
Sales
Find the fact
Tell the story
Win the pitch
Understand the market
Develop your strategy
Academia
Agencies
Consultancies
Consumer goods
Finance
Tech
Research solutions
Strategy consulting
Communication services
Explore Statista+
Statista R
Statista Healthcare
About Statista
First steps & help center
Webinar & training hub
Success stories
Individuals & Small Teams
Businesses & Enterprises
Academia & Government
English
Deutsch
Daily Data
Global stories vividly visualized
Electric Vehicles
Jan 14, 2019
This chart shows electric vehicles sales in the United States and China.
More Information
U.S. Government Shutdown
Jan 14, 2019
This chart shows the length of U.S. government shutdowns since 1976.
More Information
U.S. Government Shutdown
Jan 14, 2019
This chart shows the share of Americans who blame the following for the shutdown.
More Information
E-commerce returns
Jan 14, 2019
This chart shows the share of the population who returned online purchases in selected European countries in 2018.
More Information
United Kingdom
Jan 14, 2019
This chart looks at remain and leave voters' attitudes to potential Brexit fallout scenarios.
More Information
Statista Study
Jan 14, 2019
This chart shows opinions on the subject of transfer fees and wages in football in Europe in 2018.
More Information
North America
Jan 14, 2019
This chart shows planned admissions of immigrants to Canada from 2019 to 2021.
More Information
Brexit
Jan 11, 2019
This chart presents rolling three-month GDP growth in the United Kingdom.
More Information
Brick-and-Mortar Retail
Jan 11, 2019
This chart shows the sources of inventory shrinkage suffered by U.S. brick-and-mortar retailers in 2017.
More Information
Smoking
Jan 11, 2019
This chart shows the average cost per smoker associated with smoking one pack of cigarettes per day.
More Information
Security Technology
Jan 10, 2019
This chart shows attitudes of Americans towards the use of facial recognition technology.
More Information
Taxation
Jan 10, 2019
This chart show different high income tax rates across the world.
More Information
Immigration
Jan 10, 2019
This chart shows the total number of migrants apprehended on the US-Mexico border by financial year.
More Information
Migration
Jan 10, 2019
This chart shows the share of Americans who would like to permanently move to another country.
More Information
Author Earnings
Jan 10, 2019
This chart shows median author income in the United States by year.
More Information
Electric vehicle sales in the United States
Jan 9, 2019
This chart shows estimated plug-in electric vehicle and total light vehicles sales in the U.S. in 2018.
More Information
Apple
Jan 9, 2019
This chart shows Tim Cook's annual bonus by fiscal year.
More Information
Fatal Work Injuries
Jan 9, 2019
This chart shows civilian occupations with the highest fatal work injury rate in 2017.
More Information
World Bank
Jan 8, 2019
This chart shows a timeline of World Bank presidents between 1946 to present day.
More Information
Inflation
Jan 8, 2019
This chart shows most zeros slashed in a currency redenomination.
More Information
Government Shutdown
Jan 8, 2019
This chart shows selected results of surveys in the United States on the subject of a border wall with Mexico.
More Information
Programming Languages
Jan 8, 2019
This chart shows the share of the most popular programming languages in the world.
More Information
Jan 8, 2019
This chart shows the estimated length of peak time M20/A20 traffic queue in 2018, by length of Dover customs checks.
More Information
Mexico Border
Jan 8, 2019
This chart shows the status of barriers/walls on the U.S.-Mexico border as of Jan 06, 2019
More Information
8K TV
Jan 8, 2019
This chart shows a forecast of global Ultra HD TV adoption and 8K TV sales.
More Information
Consumer Technology
Jan 8, 2019
This chart shows a projection of revenues from emerging technology sales in the United States in 2019.
More Information
Japan
Jan 8, 2019
This chart shows the market size of contactless payment and QR code payment services in Japan (in JPY).
More Information
Apple
Jan 8, 2019
This chart shows the market capitalization of selected companies compared to Apple's recent losses.
More Information
Streaming Services
Jan 7, 2019
This chart shows the number of Golden Globe nominations and awards earned by streaming services from 2014 to 2019.
More Information
Religion in Congress
Jan 7, 2019
This chart shows the share of religions in the 116th Congress compared to the general U.S. population.
More Information
Fundraising
Jan 7, 2019
This chart shows search interest on Google for the 2019 Girl Scouts cookie sale.
More Information
Electricity Access
Jan 7, 2019
This chart shows the percent of the world's population with access to electricity.
More Information
U.S. Politics
Jan 7, 2019
This chart shows the potential Democratic candidates for 2020 that the largest share of Democrats say they would support.
More Information
Tourism
Jan 7, 2019
This chart shows money spent by international tourists in Australia between 2010 and 2018.
More Information
New Analysis
Jan 7, 2019
This chart shows figures related to unsecured debt in the United Kingdom in Q3 2018.
More Information
Twitter
Jan 7, 2019
This chart shows tweets and accounts with the most retweets as of Jan 07, 2019.
More Information
Employment Numbers
Jan 4, 2019
This chart shows the year-over-year non-farm seasonally adjusted job gains and losses between December 2008 and December 2018.
More Information
Growing markets
Jan 4, 2019
The chart shows the growth of coffee companies Starbuck and Luckin in China.
More Information
Refugees
Jan 4, 2019
This chart shows the number of refugees attempting to cross the following in 2018
More Information
Airline Punctuality
Jan 4, 2019
This chart shows the top-10 airlines worldwide by share of flights on schedule in 2018.
More Information
Apple
Jan 4, 2019
This chart shows Apple's Q4 revenue in billions of U.S. dollars between 2013 and 2018.
More Information
Media Consumption
Jan 4, 2019
This chart shows the estimated digital and physical share of media consumed in the UK, by type.
More Information
Immigration woes
Jan 4, 2019
This chart shows maximum excess wait time for green cards by nation as well as the categories most affected.
More Information
UK Entertainment Sales
Jan 4, 2019
This chart shows physical and digital entertainment sales in the UK in 2018.
More Information
Auto Loans
Jan 4, 2019
This chart shows the number of car loan accounts in the U.S. by year.
More Information
Tesla Deliveries
Jan 3, 2019
Number of Tesla vehicles delivered worldwide from Q1 2016 to Q4 2018 in units.
More Information
Carbon Dioxide Emissions
Jan 3, 2019
This chart shows the share of global carbon dioxide emissions from the cement industry between 1980 and 2017.
More Information
Chang'e 4
Jan 3, 2019
This chart provides an overview of lunar missions conducted by the China National Space Administration since 2007.
More Information
Teen Cellphone Usage
Jan 2, 2019
The share of reported teen and parents mobile usage habits.
More Information
New Year Outlook
Jan 2, 2019
This chart shows the economic, political, and personal outlook of Americans for 2019.
More Information
Global GDP Growth
Jan 2, 2019
This chart shows the real GDP growth estimates between 2018 and 2019 by region.
More Information
Plastic Waste
Jan 2, 2019
This chart shows annual plastic waste per head of the population in 2016.
More Information
New Year's Resolutions
Jan 2, 2019
This chart shows what U.S. people are wishing for in 2019.
More Information
United Kingdom
Jan 2, 2019
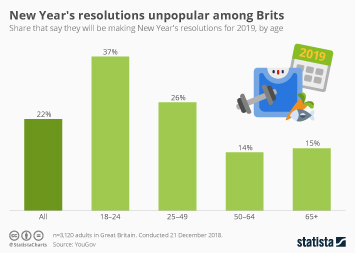
This chart shows the share of Brits that say they will be making New Year's resolutions for 2019, by age.
More Information
United Kingdom
Jan 2, 2019
This chart shows the average rail fare price increases in England and Wales from 2010 to 2019.
More Information
Trump Administration
Dec 21, 2018
This chart shows notable firings and resignations of the Trump administration.*
More Information
Christmas Tree Sales
Dec 21, 2018
This chart shows the estimated number of real & fake Christmas trees purchased in the U.S.
More Information
Syria Withdrawal
Dec 20, 2018
This chart shows coalition troops killed in Iraq before and after Bush's 2003 speech.
More Information
U.S. Politics
Dec 20, 2018
This chart shows how people that voted for Trump in 2016 say they would vote in 2020.
More Information
Migration
Dec 20, 2018
This chart shows the European countries which have the largest proportion of migrants in their population in 2017.
More Information
EU Referendums
Dec 20, 2018
This chart shows referendums on Europe that were put to a second vote.
More Information
Movie Production
Dec 19, 2018
This chart shows the total number of movies grossing $1 billion or more, by production studio.
More Information
SEO
Dec 19, 2018
This chart shows the domains with the largest number of backlinks worldwide.
More Information
Worldwide Internet Usage
Dec 19, 2018
This chart shows the number of individuals using the internet between 2004 and 2018 (in millions).
More Information
Australia
Dec 19, 2018
This chart shows renter's concerns about repair requests and share of homes needing repair in 2018.
More Information
India
Dec 19, 2018
This chart shows the share of votes by major political party in recent state elections across India 2018
More Information
Election Interference
Dec 19, 2018
This chart shows the average monthly volume of posts by Russia's Internet Research Agency.
More Information
Working Women
Dec 18, 2018
This chart shows the percent of women appearing in an online image search for a job vs. the actual percent of women in each job.
More Information
Instagram
Dec 18, 2018
This chart shows the estimated number of interactions with Russian troll farm content.
More Information
Japan
Dec 18, 2018
This chart shows the most desired holiday gifts from significant other/spending Christmas together in Japan.
More Information
United Kingdom
Dec 18, 2018
This chart shows the cumulative real pay loss since 2008.
More Information
Internet Speed
Dec 18, 2018
This chart shows the average fixed broadband download speed by U.S. city in 2018 (Mbps).
More Information
Statista Infographics Video
Dec 18, 2018
Where are the Big 4 of Tech heading? Results of our U.S. survey on Google, Apple, Facebook and Amazon
More Information
Alcohol Imports
Dec 17, 2018
This chart shows the top importers of champagne in 2017 in millions of bottles of 75 cl.
More Information
Google Trends
Dec 17, 2018
This chart shows the Google search terms most used in the U.S. for 2018, by category.
More Information
New Statista Ranking
Dec 17, 2018
This chart shows the results of a Statista/Newsweek study into America's best companies for customer service.
More Information
Apple Apps
Dec 17, 2018
This chart shows the highest grossing iOS apps for 2018.
More Information
United Kingdom
Dec 17, 2018
This chart shows the share of speaking appearances made after four days of the Brexit debate, by party.
More Information
Personal Data
Dec 14, 2018
This chart shows companies people trust least with their personal information.
More Information
Media Consumption
Dec 14, 2018
This chart shows the percent of U.S. adults who frequently get news from each platform.
More Information
China
Dec 14, 2018
This chart shows the number of people living below the international poverty line.
More Information
Gun Deaths
Dec 13, 2018
This chart shows the number of U.S. gun deaths due to firearms (1999-2017).
More Information
Yellow Vest
Dec 13, 2018
This chart shows a timeline of the French Yellow Vest protests in 2018.
More Information
Mobile Internet
Dec 13, 2018
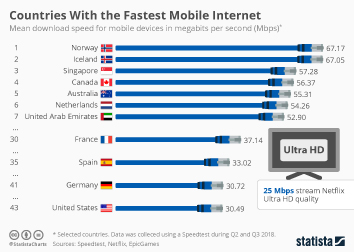
This chart shows the mean download speed for mobile devices in megabits per second (Mbps).
More Information
Football
Dec 13, 2018
This chart shows the NFL salary cap from 2003 to 2019.
More Information
United Kingdom
Dec 13, 2018
This chart explains the stages and potential outcomes of the Conservative party's 'vote of no confidence' process.
More Information
Sponsored Post
Dec 13, 2018
This infographic shows the current state of and future challenges for European banks.
More Information
Holiday Parties
Dec 13, 2018
This chart shows the share of U.S. companies planning to hold a holiday party and the share of companies concerned about inappropriate...
More Information
Australia
Dec 12, 2018
This charts shows a distribution of time spent online by Australians, by platform/website type in August 2018.
More Information
Internet Use
Dec 12, 2018
This chart shows the number of internet users in China from December 2006 to December 2017 (in millions).
More Information
103
/
161
Contact
Get in touch with us. We are happy to help.
Do you still have questions?
Feel free to contact us anytime using our
contact form
or visit our
FAQ page
.
Your contact to the Infographics Newsroom
Felix Richter
Data Journalist
felix.richter@statista.com
+49 (40) 284 841 557