Skip to main content
Consumer Goods & FMCG
E-Commerce
Economy & Politics
Energy & Environment
Health, Pharma & Medtech
Internet
Media
Technology & Telecommunications
Transportation & Logistics
Travel, Tourism & Hospitality
View all industries
Global data volume growth
Global AI market size
Number of generative AI users worldwide
Global inflation rate
Retail e-commerce sales worldwide
Largest economies worldwide
Biggest social media platforms by users
Global EV market share by manufacturer
International tourist arrivals by world region
Global annual CO₂ emissions
Browse recent statistics
Artificial intelligence (AI) worldwide
TikTok
Nvidia
E-commerce worldwide
Global GDP
Instagram
Apparel market worldwide
Video gaming worldwide
Global renewable energy industry
Influencer marketing worldwide
Browse recent topics
Consumer Trends 2026
Artificial Intelligence: in-depth market analysis
E-commerce challenges
Global economy
TikTok
Luxury goods: in-depth market analysis
Electric vehicles: A global overview
Video gaming worldwide
Travel and tourism trends 2026
Battery recycling worldwide
Browse recent reports
Explore the tool
Explore Classic mode
Advertising & Media
eCommerce
Consumer
Finance
Global Indicators
Health
Industrial
Mobility
Technology
Explore Market Insights
eCommerce Insights
Research AI
Book a demo
All integrations
Developer docs
Explore Statista Connect
Research
Strategy & Consulting
Marketing
Media & PR
Explore AI assistants
Marketing
Research & Development
Strategy
Sales
Find the fact
Tell the story
Win the pitch
Understand the market
Develop your strategy
Academia
Agencies
Consultancies
Consumer goods
Finance
Tech
Research solutions
Strategy consulting
Communication services
Explore Statista+
Statista R
Statista Healthcare
About Statista
First steps & help center
Webinar & training hub
Success stories
Individuals & Small Teams
Businesses & Enterprises
Academia & Government
English
Deutsch
Daily Data
Global stories vividly visualized
Sponsored Post
Jan 30, 2019
The infographic illustrates a vision for a future-proof European mobility industry.
More Information
Apple
Jan 29, 2019
This chart shows estimated and predicted worldwide unit sales of Apple AirPods.
More Information
2018 Corruption Perceptions Index
Jan 29, 2019
This chart shows countries ranked on perceived public sector corruption in 2018.
More Information
Russia
Jan 29, 2019
This chart shows the share of Russians who are most proud of the following in the country's history.
More Information
Venezuela
Jan 29, 2019
This chart shows key economic/social data about Venezuela.
More Information
Ireland
Jan 29, 2019
This chart shows survey responses in Ireland regarding a united Ireland and hard border.
More Information
Wealth
Jan 29, 2019
This chart shows responses to the question "would you consider someone earning the following amount (before tax) annually to be rich?"
More Information
Oil
Jan 28, 2019
This chart shows U.S. imports of crude oil and petroleum products in 2017.
More Information
German Autobahn
Jan 28, 2019
This chart shows the expected change in emissions by limiting autobahn speeds to 120kmh.
More Information
Venezuela
Jan 28, 2019
This chart shows Venezuela's most important export partners in 2017.
More Information
German Tax System
Jan 28, 2019
This chart shows the days of processing time per tax return in tax offices in 2018.
More Information
Fintech
Jan 28, 2019
This chart shows user behavior in India regarding downloading, registering for and using fintech apps.
More Information
German Autobahn
Jan 28, 2019
This chart provides a breakdown of speed limits on stretches of autobahn with no roadworks.
More Information
Afghanistan
Jan 28, 2019
This chart shows casualty figures disclosed by Afghan President Ghani at Davos in January 2019.
More Information
Postage
Jan 28, 2019
This chart shows mail volumes in the United States as well as the price of Forever Stamps.
More Information
New Study
Jan 28, 2019
This chart shows the Great British cities with the largest decreases in local authority services spending from 09/10 to 17/18.
More Information
Venezuela Crisis
Jan 28, 2019
This chart shows the share who trust the government a lot/somewhat do do what's right for Venezuela in Q3 2018.
More Information
Government Shutdown
Jan 25, 2019
This chart shows an overview of the cost of the partial government shutdown.
More Information
Internet Use
Jan 25, 2019
This chart shows the share of people who had used the internet in the past 3 months, by country.
More Information
Automation
Jan 25, 2019
This chart shows the selected jobs at risk for automation by occupation.
More Information
Government Shutdown
Jan 25, 2019
This chart shows a collection of statistics about the partial 2018-2019 government shutdown.
More Information
New Figures
Jan 25, 2019
This chart shows the European football clubs with the highest average ticket prices.
More Information
Counterfit Euro Notes
Jan 25, 2019
This chart shows the number of counterfeit euro notes in circulation and breakdown by denomination.
More Information
U.S. Diplomatic Relations
Jan 25, 2019
This chart shows timelines for countries with no diplomatic relations with the U.S.
More Information
Work Accidents
Jan 25, 2019
This chart lists the most dangerous professions in Australia.
More Information
Venezuela Crisis
Jan 25, 2019
This chart shows international support for Guaido/Maduro on Jan 25, 2019.
More Information
Brexit
Jan 25, 2019
This chart presents key figures related to Airbus operations in the United Kingdom in 2018.
More Information
Aritifical Intelligence
Jan 24, 2019
This chart shows the potential added value of A.I. for the media industry in billions of U.S. dollars.
More Information
Brexit
Jan 24, 2019
This chart shows the number of car and HGV crossings in 2017.
More Information
U.S. home entertainment market
Jan 24, 2019
This chart shows consumer spending on home entertainment in the United States in 2018.
More Information
Trump Administration
Jan 24, 2019
This chart shows the number of false or misleading claims made by President Trump during his presidency.
More Information
United Kingdom
Jan 24, 2019
This chart shows survey responses to the question: "Which of the following steps, if any, do you think the Prime Minister should now...
More Information
Mortgage lending
Jan 24, 2019
This chart shows the share of the population in Europe who are owner-occupiers in 2018, split by whether or not they have an outstanding...
More Information
Health
Jan 24, 2019
This chart shows the number of abortions in Northern Ireland and the number carried out for Northern Irish women in England and Wales.
More Information
EU Army
Jan 24, 2019
This chart shows the percentage of respondents who support the creation of an EU army (2017).
More Information
Trump Administration
Jan 23, 2019
This chart shows the number of false or misleading claims made by President Trump, by topic.
More Information
Immigration
Jan 23, 2019
This chart shows public support for high skilled immigration/share of immigrants with a college degree in 2019
More Information
Business
Jan 23, 2019
This chart shows a distribution of the number and value of M&A deals in 2018, by region.
More Information
World Wealth
Jan 23, 2019
This chart shows an overview of global wealth and poverty.
More Information
New Survey
Jan 23, 2019
This chart shows the share of global CEOs that agree/disagree with certain statements on A.I.
More Information
Video Game Industry
Jan 23, 2019
This chart shows total revenue of the U.S. video game industry from 2016 to 2018.
More Information
Lobbying expenditure
Jan 23, 2019
This chart shows lobbying expenditure of selected tech companies.
More Information
Tablets
Jan 23, 2019
This chart shows shipments forecast of tablets, laptops, and desktop PCs worldwide in million of units.
More Information
News Consumption
Jan 23, 2019
This chart shows the self-reported news engagement and sharing habits of respondents between 2018 and 2019.
More Information
Government Shutdown
Jan 23, 2019
This chart shows the number of Americans affected by the government shutdown in various ways.
More Information
Foreign Visitors
Jan 23, 2019
This chart shows the money spent by tourists in India as well as the number of countries eligable for e-visas.
More Information
Real Estate
Jan 23, 2019
This chart shows the availabilty of office space in Tokyo's main business districts during 2018, as well as prices for that office...
More Information
United Kingdom
Jan 23, 2019
This chart shows forecast change in real gross value added (GVA) by 2034 in the case of a no deal Brexit, by region/country.
More Information
Vaccines
Jan 22, 2019
This chart shows the opinion of Americans on the right not to vaccinate depending on their assessment of their knowledge of autism.
More Information
Global Growth
Jan 22, 2019
This chart shows the countries most named by Chinese CEOs when asked where they wanted to grow their business.
More Information
Second-Screen Usage
Jan 22, 2019
This chart shows how often Americans use digital devices while watching TV.
More Information
Presidential Golf
Jan 22, 2019
This chart shows rounds of golf during presidents' first two years in office
More Information
News Industry
Jan 22, 2019
This chart shows the revenue streams cited as most important for news companies in 2019.
More Information
New Projections
Jan 22, 2019
This chart displays global year-on-year output growth estimates and projections as of January 2019.
More Information
New Study
Jan 22, 2019
This chart shows the threats to business growth that global CEOs are 'extremely concerned' about in 2019.
More Information
U.S. Politics
Jan 22, 2019
This chart shows the share of the U.S. public with an unfavorable/favorable view of Nancy Pelosi.
More Information
Cold Season
Jan 21, 2019
This chart shows scientifically proven and folklore strategies employed by U.S. parents to prevent the common cold in their children.
More Information
Social Media
Jan 21, 2019
This chart shows how many Americans think it would be easy for social media companies to figure out certain things about them based...
More Information
Human Trafficking
Jan 21, 2019
This chart shows detected victims of human trafficking in 2016.
More Information
Railway Investment
Jan 21, 2019
This chart shows the level of investment in rail infrastructure per citizen in European countries in 2017.
More Information
Overqualified Workers
Jan 21, 2019
This chart shows overqualification rates among workers in selected OECD countries in 2017.
More Information
Amazon
Jan 18, 2019
This chart shows the estimated number of Amazon Prime members in the United States.
More Information
United Kingdom
Jan 18, 2019
This chart shows the percentage point difference between NHS England's performance and its waiting times standards.
More Information
Trade
Jan 18, 2019
This chart shows the UK's level of food self-sufficiency from 1987 to 2017.
More Information
Treasury Bonds
Jan 17, 2019
This chart shows the U.S. treasury bond sales between February 2007 and November 2018.
More Information
Carbon Dioxide Emissions
Jan 17, 2019
This chart shows annual changes in U.S. CO2 emissions between 2000 to 2018.
More Information
Pests
Jan 17, 2019
This chart shows the U.S. cities with most bed bug treatments performed in 2018 as well as change in rank compared to 2017.
More Information
Netflix
Jan 17, 2019
THis chart provides an overview of Netflix' price increases in the United States.
More Information
EU
Jan 17, 2019
This chart shows the percent of people who agree that their voice counts in the EU, by country.
More Information
U.S. Medical Care
Jan 17, 2019
This chart shows the share of Americans delaying medical care by household income in 2019.
More Information
Coal Closures
Jan 16, 2019
This chart shows the coal retirement announcements in the U.S. by energy produced in gigawatts.
More Information
Apps
Jan 16, 2019
This chart shows the apps with the highest number of downloads from the Play Store in Australia in 2018.
More Information
Media Use
Jan 16, 2019
This chart illustrates how much time American adults spend using electronic media per day.
More Information
United Kingdom
Jan 16, 2019
This chart shows what people in Britain think will happen with Brexit after the prime minister's deal was rejected.
More Information
Brexit
Jan 16, 2019
This chart explains the 'vote of no confidence' process in UK politics.
More Information
Brexit
Jan 16, 2019
This chart shows the margin of defeat for government motions since 1918.
More Information
Twitter
Jan 15, 2019
This chart shows the total interactions on Twitter.
More Information
Cybersecurity Market
Jan 15, 2019
This chart shows the global market share held by security appliance vendors from Q2 2013 to Q2 2018.
More Information
Apps
Jan 15, 2019
This chart shows the apps with the highest number of downloads from the Play Store in the U.S. in 2018.
More Information
Apps
Jan 15, 2019
This chart shows the apps with the highest number of downloads from the Play Store in the UK in 2018.
More Information
Apps
Jan 15, 2019
This chart shows the apps with the highest number of downloads from the Play Store in 2018.
More Information
GDP Growth
Jan 15, 2019
This chart shows a projection of the world's fastest growing cities by GDP between 2019 and 2035.
More Information
Weight Loss
Jan 15, 2019
This chart shows dieting methods used by Japanese women to combat extra weight put on over the holidays.
More Information
Chechnya
Jan 15, 2019
This chart shows the estimated number of LGBT people detained/killed in Chechen purges
More Information
Artificial Intelligence
Jan 15, 2019
This chart shows the attitudes of Americans towards the development of high-level machine intelligence.
More Information
Social Media
Jan 15, 2019
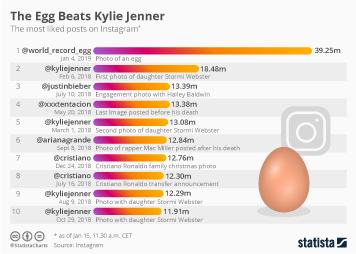
This chart shows the most liked Instagram posts as of Jan 15, 11.30 a.m. CET.
More Information
New Figures
Jan 15, 2019
This chart shows the European countries where the largest share of pensioners are at risk of poverty in 2017.
More Information
U.S. Politics
Jan 14, 2019
This chart shows United States goods exports to/imports from Turkey from 2009 to 2018.
More Information
Electric cars
Jan 14, 2019
This chart shows the best-selling electric cars in the United States in 2018.
More Information
Fertility
Jan 14, 2019
This chart shows the number of births per 1,000 women in U.S. states in 2017.
More Information
102
/
161
Contact
Get in touch with us. We are happy to help.
Do you still have questions?
Feel free to contact us anytime using our
contact form
or visit our
FAQ page
.
Your contact to the Infographics Newsroom
Felix Richter
Data Journalist
felix.richter@statista.com
+49 (40) 284 841 557