Skip to main content
Consumer Goods & FMCG
E-Commerce
Economy & Politics
Energy & Environment
Health, Pharma & Medtech
Internet
Media
Technology & Telecommunications
Transportation & Logistics
Travel, Tourism & Hospitality
View all industries
Global data volume growth
Global AI market size
Number of generative AI users worldwide
Global inflation rate
Retail e-commerce sales worldwide
Largest economies worldwide
Biggest social media platforms by users
Global EV market share by manufacturer
International tourist arrivals by world region
Global annual CO₂ emissions
Browse recent statistics
Artificial intelligence (AI) worldwide
TikTok
Nvidia
E-commerce worldwide
Global GDP
Instagram
Apparel market worldwide
Video gaming worldwide
Global renewable energy industry
Influencer marketing worldwide
Browse recent topics
Consumer Trends 2026
Artificial Intelligence: in-depth market analysis
E-commerce challenges
Global economy
TikTok
Luxury goods: in-depth market analysis
Electric vehicles: A global overview
Video gaming worldwide
Travel and tourism trends 2026
Battery recycling worldwide
Browse recent reports
Explore the tool
Explore Classic mode
Advertising & Media
eCommerce
Consumer
Finance
Global Indicators
Health
Industrial
Mobility
Technology
Explore Market Insights
eCommerce Insights
Research AI
Book a demo
All integrations
Developer docs
Explore Statista Connect
Research
Strategy & Consulting
Marketing
Media & PR
Explore AI assistants
Marketing
Research & Development
Strategy
Sales
Find the fact
Tell the story
Win the pitch
Understand the market
Develop your strategy
Academia
Agencies
Consultancies
Consumer goods
Finance
Tech
Research solutions
Strategy consulting
Communication services
Explore Statista+
Statista R
Statista Healthcare
About Statista
First steps & help center
Webinar & training hub
Success stories
Individuals & Small Teams
Businesses & Enterprises
Academia & Government
English
Deutsch
Daily Data
Global stories vividly visualized
Video streaming
Feb 2, 2017
This chart shows how video streaming services in the United States are perceived by its subscribers.
More Information
War Against ISIS
Feb 2, 2017
This chart shows the total cost of U.S. combat operations against ISIS (Aug 2014-Dec 2016).
More Information
Politics & Religion
Feb 1, 2017
This chart shows majority Muslim countries & those affected by U.S. President Donald Trump's executive order (travel ban) & U.S. armed...
More Information
NATO
Feb 1, 2017
This chart shows the composition of NATO forces stationed in Eastern Europe.
More Information
Apple's quarterly earnings report
Feb 1, 2017
This chart shows the rise in Apple's cash holdings since 2008.
More Information
Terrorism
Feb 1, 2017
This chart shows the citizenship status of people involved in U.S. jihadist terrorism cases since 9/11.
More Information
U.S. Foreign Trade
Jan 31, 2017
This chart shows U.S. trade balances with selected trading partners (Nafta & TPP*, China) and their GDP
More Information
GDP growth of the United States
Jan 31, 2017
This chart compares GDP growth rates of the United States and the Eurozone.
More Information
U.S. fruit and vegetable imports
Jan 31, 2017
This chart shows the most important suppliers of fresh fruit and vegetables for the United States.
More Information
Donald Trumo
Jan 31, 2017
This chart shows the U.S. presidents by number of days in office until Gallup disapproval rating hit 50 percent.
More Information
The next big thing in tech?
Jan 30, 2017
This chart shows where people use digital voice assistants.
More Information
Fuel Prices
Jan 30, 2017
This chart shows fuel prices in Ireland from 2004 to 2017 (every January).
More Information
Corruption
Jan 30, 2017
This chart shows countries and territories ranked on perceived public sector corruption in 2016.
More Information
Roger Federer wins his 18th Grand Slam title
Jan 30, 2017
This chart shows when and where Roger Federer won his record-breaking 18 Grand Slam titles.
More Information
Border Wall
Jan 27, 2017
This chart shows the top US imports from Mexico in 2015.
More Information
Talks about a Verizon-Charter merger
Jan 27, 2017
This chart shows the largest pay-TV and home broadband providers in the United States.
More Information
Good Government
Jan 27, 2017
This chart shows the Corruption Perception Index (CPI) score for selected countries 2016
More Information
Digital payments in the United States
Jan 26, 2017
This chart shows the estimated growth in mobile payment transaction volume in the U.S.
More Information
E-Commerce
Jan 26, 2017
This chart shows annual e-commerce growth rates in the UK from 2009 to 2017.
More Information
Primates
Jan 26, 2017
This chart shows the % of global primate species threatened and with declining populations in 2017.
More Information
Immigration
Jan 26, 2017
This chart shows countries where Trump is expected to announce immigration restrictions.
More Information
Torture
Jan 26, 2017
This chart shows agreement with the statement "torture is justified in some cases to protect the public".
More Information
Stock Market
Jan 26, 2017
This chart shows the Dow Jones Industrial Average (DJIA) since November 2016, with selected dates highlighted
More Information
Oil & Gas
Jan 26, 2017
This chart shows U.S. pipeline mileage broken down by hazardous liquids or CO2 (2005 to 2015)
More Information
Fixed-term saving accounts
Jan 26, 2017
This chart displays the highest interest of fixed-term savings accounts in the Netherlands by maturity.
More Information
Brexit
Jan 25, 2017
This chart shows the % saying that each Brexit negotiationg target is "the right thing to do".
More Information
Billion-dollar startups
Jan 25, 2017
This chart shows the number of privately held companies with a valuation of $1 billion or higher.
More Information
President Trump announces new FCC chairman
Jan 25, 2017
This chart illustrates the content/media brands held (or about to be held) by internet service providers in the United States.
More Information
Donald Trump
Jan 25, 2017
This chart shows the % thinking Donald Trump will be a good/bad president in selected countries.
More Information
Man-Made Barriers
Jan 25, 2017
This chart shows key figures and cost estimates for the Mexico-U.S border wall proposed by the 45th President of the United States...
More Information
Global warming
Jan 24, 2017
This chart illustrates how the average global temperature has changed since 1880.
More Information
Amazon opens new fulfillment centers across the U.S.
Jan 24, 2017
This chart shows how Amazon's logistics network sprawls across the U.S.
More Information
Free Trade Agreements
Jan 24, 2017
This chart shows the number of U.S. workplaces supported by exports of goods & services to Trans-Pacific Partnership countries
More Information
Immigration
Jan 24, 2017
This chart shows the origin countries of immigrants living in the U.S. in 2015.
More Information
Brexit
Jan 24, 2017
This chart shows what Brexit scenarios the British want (total, remainers and leavers, in percent)
More Information
Health
Jan 23, 2017
This chart shows the number of spinal procedures by waiting time in selected Irish hospitals.
More Information
U.S. Foreign Policy
Jan 23, 2017
This chart shows the number of U.S. bombs dropped in countries in 2016.
More Information
Public Transportation
Jan 23, 2017
This chart shows the number of metro riders at 11 a.m. in Washington D.C. at inaugurations & Women's March
More Information
Public Transportation
Jan 23, 2017
This chart shows the top 10 cities with the busiest light rail systems (in 1,000 unlinked transit passenger trips)
More Information
Inauguration Day
Jan 20, 2017
This chart shows the amount of donations raised for the inauguration of selected U.S. presidents (in $m)
More Information
Alcohol
Jan 20, 2017
This chart shows the % prevalence estimate of alcohol use during pregnancy worldwide.
More Information
Inauguration Day
Jan 20, 2017
This chart shows percent of Americans who plan(ned) to watch inaugurations of selected U.S. presidents
More Information
Inauguration Day
Jan 20, 2017
This chart shows followers of selected Twitter accounts worldwide as of Jan. 20, 2017 (in millions)
More Information
Connected car services
Jan 19, 2017
This chart shows global coverage of real-time traffic information services.
More Information
Revenue ranking of football clubs
Jan 19, 2017
This chart ranks the world's largest football clubs in terms of non-transfer revenue generated in the 2015/16 season.
More Information
Animals
Jan 19, 2017
This chart shows deaths caused by horses compared to venomous animals in Australia from 2000 to 2013.
More Information
Online Advertising
Jan 19, 2017
This chart shows what measures audiences think would improve native advertising (in percent)
More Information
Crypto-currencies
Jan 19, 2017
This graphic shows the market caps of the ten largest crypto-currency markets (in million euros).
More Information
Chief Executives
Jan 19, 2017
This chart shows the % rating CEOs as extremely/very credible in selected countries in 2017.
More Information
U.S. Politics
Jan 19, 2017
This chart shows the number of executive orders issued on average by U.S. presidents per year since Lincoln
More Information
Mergers & Acquisitions
Jan 19, 2017
This chart shows the number of tech M&As between 2012-2016 by tech company
More Information
Tobacco
Jan 18, 2017
This chart shows the prevalence of smoking among U.S. adults as of 2016, by ethnicity and as percentage of the general population
More Information
Migrants
Jan 18, 2017
This chart shows the number of migrants resident in/sent by country as of 2015.
More Information
Mergers & Acquisitions
Jan 18, 2017
Listed tobacco companies worldwide in 2016, based on enterprise value (in bilion U.S. dollars)
More Information
Gluten
Jan 18, 2017
This chart shows the percentage of Americans on a gluten-free diet with/without celiac disease.
More Information
Brexit
Jan 17, 2017
This chart shows what British & German business executives think are the most important advantages & disadvantages of the EU
More Information
Bonus
Jan 17, 2017
This chart shows the average annual cash bonus in U.S. jobs in 2016.
More Information
Authoritarianism
Jan 17, 2017
This chart shows the desire for a strong leader willing to break the rules to fix a country in selected states
More Information
Music consumption in the U.S. rising to record levels
Jan 16, 2017
This chart shows how music consumption in the United States has changed in 2016 compared to the previous year.
More Information
Investment
Jan 16, 2017
This chart shows money invested by sector and state over the last 20 years.
More Information
Fuel prices
Jan 16, 2017
This graphic shows the development of fuel prices in the Netherlands from January 2016 to January 2017.
More Information
Brexit
Jan 16, 2017
This chart shows the countries most optimistic and pessimistic about the EU's future in Dec 2016.
More Information
Global Inequality
Jan 16, 2017
This chart shows the wealth of the richest people on the planet in 2016 compared to that of the less fortunate
More Information
Cars
Jan 16, 2017
This chart illustrates the range of selected electronic cars (in miles)
More Information
NATO
Jan 16, 2017
This chart shows weight & number of U.S. military vehicles deployed to Eastern Europe as part of NATO Operation "Atlantic Resolve"
More Information
Vexillology
Jan 13, 2017
Most frequent colors and number of colors per flag used in national flags worldwide (in percent)
More Information
The decline of the PC industry
Jan 13, 2017
This chart shows global PC shipments since 2006.
More Information
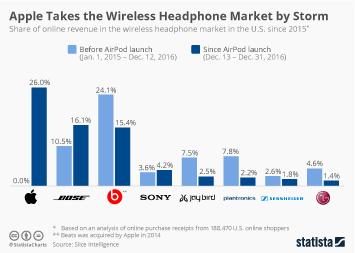
Wireless headphone sales
Jan 13, 2017
This chart shows the most popular wireless headphone brands in the U.S. before and after Apple's AirPods went on sale.
More Information
Crypto Currencies
Jan 13, 2017
This chart shows the top ten countries with most Bitcoin ATMs installed and penetration by continent (in percent)
More Information
IS in Syria & Iraq
Jan 13, 2017
This chart shows selected fines/punishments imposed by the Islamic State for deviant behaviour
More Information
Families
Jan 12, 2017
This chart shows estimated expenses raising a child from birth to age 18 in the U.S. (2015).
More Information
Connected Car
Jan 12, 2017
This chart illustrates the growth of the connected car market in million U.S. dollars (2016 – 2021), by category
More Information
Job Market
Jan 12, 2017
This chart shows the percentage of jobs still open after 60 days.
More Information
Crime Statistics
Jan 12, 2017
This chart shows U.S. cities by highest number of murders per 100,000 inhabitants 2016
More Information
Media & Information
Jan 12, 2017
This chart shows views of U.S. adults on whether fake news has the power to sow confusion
More Information
Brands
Jan 11, 2017
This chart illustrates the growth in brand value of the FIFA World Cup (from 2012 – 2016)
More Information
Influencer
Jan 11, 2017
This chart illustrates the average earnings per influencer post, by number of account followers and social media network (in thousand...
More Information
Migration
Jan 11, 2017
This chart illustrates the most popular job searches within the EU15, by country of origin and desired destination
More Information
Streaming
Jan 11, 2017
This chart shows viewing figures from original shows in 2016 (based on first 35 days of release).
More Information
HIV
Jan 11, 2017
This chart shows the top-10 countries for new HIV cases in Europe in 2015.
More Information
Weather
Jan 11, 2017
This chart illustrates the average number of snow falling days within the snowiest places in the UK
More Information
Obama
Jan 11, 2017
This chart shows responses to the question "has the U.S. has made progress/lost ground on these issues under Obama?" (%).
More Information
Automotive Industry
Jan 11, 2017
This chart shows production of automobiles in Mexico by maker 2016 & total production in selected countries 2015
More Information
Military Interventions
Jan 11, 2017
This chart shows the number of bombs dropped on targets in selected countries by U.S. Forces 2015 & 2016
More Information
Renewable Energy
Jan 10, 2017
This chart illustrates the percentage of renewable energy in the power supply of leading tech companies
More Information
Fintech
Jan 10, 2017
This chart illustrates the number of investments made by banks into Fintech firms
More Information
Politics & Finances
Jan 10, 2017
This chart shows the change in value of foreign currencies against the U.S. Dollar since Trump's election on Nov. 8, 2016 to Jan 2017
More Information
Obama's Legacy
Jan 10, 2017
This chart shows selected economic parameters at beginning and end of Barack Obama's presidency (2009-2017)
More Information
Social Media
Jan 9, 2017
This chart illustrates the user numbers of both Instagram and Snapchat (in millions)
More Information
Baby Names
Jan 9, 2017
This chart shows the number of birth certificates with the following forenames in 2016.
More Information
132
/
161
Contact
Get in touch with us. We are happy to help.
Do you still have questions?
Feel free to contact us anytime using our
contact form
or visit our
FAQ page
.
Your contact to the Infographics Newsroom
Felix Richter
Data Journalist
felix.richter@statista.com
+49 (40) 284 841 557