Skip to main content
Consumer Goods & FMCG
E-Commerce
Economy & Politics
Energy & Environment
Health, Pharma & Medtech
Internet
Media
Technology & Telecommunications
Transportation & Logistics
Travel, Tourism & Hospitality
View all industries
Global data volume growth
Global AI market size
Number of generative AI users worldwide
Global inflation rate
Retail e-commerce sales worldwide
Largest economies worldwide
Biggest social media platforms by users
Global EV market share by manufacturer
International tourist arrivals by world region
Global annual CO₂ emissions
Browse recent statistics
Artificial intelligence (AI) worldwide
TikTok
Nvidia
E-commerce worldwide
Global GDP
Instagram
Apparel market worldwide
Video gaming worldwide
Global renewable energy industry
Influencer marketing worldwide
Browse recent topics
Consumer Trends 2026
Artificial Intelligence: in-depth market analysis
E-commerce challenges
Global economy
TikTok
Luxury goods: in-depth market analysis
Electric vehicles: A global overview
Video gaming worldwide
Travel and tourism trends 2026
Battery recycling worldwide
Browse recent reports
Explore the tool
Explore Classic mode
Advertising & Media
eCommerce
Consumer
Finance
Global Indicators
Health
Industrial
Mobility
Technology
Explore Market Insights
eCommerce Insights
Research AI
Book a demo
All integrations
Developer docs
Explore Statista Connect
Research
Strategy & Consulting
Marketing
Media & PR
Explore AI assistants
Marketing
Research & Development
Strategy
Sales
Find the fact
Tell the story
Win the pitch
Understand the market
Develop your strategy
Academia
Agencies
Consultancies
Consumer goods
Finance
Tech
Research solutions
Strategy consulting
Communication services
Explore Statista+
Statista R
Statista Healthcare
About Statista
First steps & help center
Webinar & training hub
Success stories
Individuals & Small Teams
Businesses & Enterprises
Academia & Government
English
Deutsch
Daily Data
Global stories vividly visualized
Leicester sack Ranieri
Feb 24, 2017
This chart looks at the Premier League managers sacked within one year of winning the league title.
More Information
89th Academy Awards
Feb 24, 2017
This chart shows the most Oscar-nominated actors and how many awards they have won.
More Information
Alcoholic Beverages
Feb 24, 2017
This chart shows alcoholic beverages purchased regularly by U.S. consumers 2016
More Information
Crowdfunding
Feb 23, 2017
This chart shows a selection of particularly successful crowdfunding campaigns.
More Information
Brexit
Feb 23, 2017
This chart shows how people in the UK imagine their country's foreign relations post-Brexit.
More Information
Q4 results
Feb 23, 2017
This chart shows spending on R&D and losses made by Tesla from 2010 to 2016.
More Information
Chores
Feb 23, 2017
This chart shows percentage of people in the UK who enjoy/dislike the following household chore.
More Information
Social Media
Feb 23, 2017
This chart shows the regional distribution of desktop traffic to Instagram, by country
More Information
Presidential Travel
Feb 23, 2017
This chart shows the estimated cost of Trump and Obama's travel expenses.
More Information
Media & Politics
Feb 23, 2017
This chart shows U.S. voters' attitudes towards the trustworthiness of the media and/or the president (in percent)
More Information
Chinese e-commerce market
Feb 22, 2017
This chart ranks China's largest B2C e-commerce platforms in terms of market share 2016.
More Information
Amazon's revenue by geography
Feb 22, 2017
This chart shows where Amazon generates its revenue.
More Information
Digital marketing channels
Feb 22, 2017
This chart shows how marketing professionals plan to adjust their digital marketing budget in 2017.
More Information
Employment
Feb 22, 2017
This chart shows the share of foreign-born workers in selected employment sectors 2015 in the UK
More Information
ISIS
Feb 22, 2017
This chart shows sources of income for the so-called Islamic State group (million U.S. dollars).
More Information
Law Enforcement
Feb 22, 2017
Enacted border patrol program budget in the United States (in million U.S. dollars)
More Information
Sanctuary Cities
Feb 22, 2017
This chart shows U.S. metro areas with the most unauthorized migrants
More Information
89th Academy Awards
Feb 22, 2017
This chart shows the effect an Oscar win has on viewers' likelihood to watch a film.
More Information
Donald Trump
Feb 21, 2017
This chart shows approval ratings for US presidents after one month in office.
More Information
Donald Trump
Feb 21, 2017
This chart shows the percent of the electoral college vote won by presidents since Reagan.
More Information
Elections
Feb 21, 2017
This chart displays the political party preference of Dutch voters in February 2017, by age.
More Information
Employment
Feb 21, 2017
This chart shows the % of people who find their job boring or not.
More Information
YouTube scandal
Feb 21, 2017
This chart shows the number of new subscribers to the YouTube channel PewDiePie since an anti-Semitism scandal hit the contributor.
More Information
Rental Costs
Feb 21, 2017
This chart shows the annual income needed for a single person renting in global cities in 2017.
More Information
Banking
Feb 21, 2017
This chart shows the profit before tax of HSBC in 2015 and 2016.
More Information
Military & Defence
Feb 21, 2017
This chart shows direct financial contributions to the running of NATO (in million U.S. dollars)
More Information
Online News Consumption
Feb 21, 2017
This chart shows total mobile and desktop visits for selected U.S. online news sites (in millions)
More Information
Banking & Investment
Feb 20, 2017
This chart show the shareholder structure and major investors of Deutsche Bank
More Information
Generation Rent
Feb 20, 2017
This chart shows the average rental cost per square foot in selected global cities in 2017
More Information
Cigarettes
Feb 20, 2017
This chart shows the quantity of cigarettes seized and total number of seizures (2012-2016).
More Information
Smartphone Market
Feb 20, 2017
This chart shows the changes in smartphone operating system market share since 2009.
More Information
Media & Politics
Feb 20, 2017
This chart shows average daily prime-time viewers of selected tv networks in the first 6 weeks (in million)
More Information
Arms & Defense
Feb 20, 2017
This chart shows worldwide arms exports (in SIPRI trend-indicator value, US $ million) and major exporters (in %)
More Information
Takeover Bid
Feb 17, 2017
This chart pulls together key figures to compare Kraft Heinz and Unilever.
More Information
Agricultural Exports
Feb 17, 2017
This chart shows export destinations of Canadian maple products (sugar & syrup) worldwide 2015
More Information
Tribunals
Feb 17, 2017
This chart shows Tribunals of Inquiry by cost in Ireland since 1990.
More Information
London House Prices
Feb 17, 2017
This chart shows the average house price across London boroughs in November 2016.
More Information
Inflation
Feb 17, 2017
This chart shows the annual inflation rate in the Netherlands in January 2017, by product.
More Information
Defense
Feb 16, 2017
This chart shows defense spending of the United States and other NATO-Members 2016
More Information
Robo-Advisors
Feb 16, 2017
This chart shows top Robo-Advisors by assets under management (in million U.S. dollars).
More Information
America's Foes
Feb 16, 2017
This chart shows the percentage of American adults considering these countries an enemy of the U.S.
More Information
Tech Industry
Feb 16, 2017
This chart shows the long-term goal of global tech and healthcare startups as of November 2016.
More Information
Snapchat
Feb 16, 2017
This chart shows the revenue and cost of revenue of Snap Inc. in 2015 and 2016.
More Information
Book Sales
Feb 15, 2017
This chart shows best-selling books in the U.S. in the 2nd Week of February 2017
More Information
Feb 15, 2017
This chart compares revenue growth of selected tech companies in Q4 2016.
More Information
General Motors Europe
Feb 15, 2017
This chart shows revenue & profit (EBIT) for General Motors Europe (in million U.S. dollars)
More Information
Digital Civility
Feb 15, 2017
This chart shows digital civility index scores by country.
More Information
Preferred Music platforms in the U.S.
Feb 14, 2017
This chart shows U.S. consumers' preferrred digital music platforms.
More Information
Valentine's Day
Feb 14, 2017
This chart shows key Valentine's Day figures in the United States in 2017.
More Information
Travel & Tourism
Feb 14, 2017
This chart shows the number of foreign visitors to New York City, by country of origin (in 1,000s)
More Information
U.S. Politics
Feb 14, 2017
This chart shows US National Security Advisors by days served in office.
More Information
Electric cars
Feb 14, 2017
This chart displays the newly-registered passenger cars in the Netherlands in 2016, by type.
More Information
American Dream
Feb 14, 2017
This chart shows responses to the question: "which of the following concepts are essential for the American Dream?"
More Information
Scottish Independence
Feb 14, 2017
This chart shows attitudes towards independence in Scotland.
More Information
Valentine's Day
Feb 14, 2017
This chart shows the most popular Valentine's Day gifts in the U.S. in 2017.
More Information
Live video usage in the U.S.
Feb 13, 2017
This chart shows which services U.S. internet users turn to in order to stream live video.
More Information
Alcohol
Feb 13, 2017
This chart shows alcohol's impact on health in Ireland.
More Information
Trade Balance Sheets
Feb 13, 2017
This chart shows trade balances of Germany and the Unites States 2016 (in $ billions)
More Information
Grammys
Feb 13, 2017
This chart shows the total Grammy wins and nominations of Adele and Beyoncé as of February 2017.
More Information
Education
Feb 13, 2017
This chart shows the top U.S. colleges for donations in fiscal year 2016.
More Information
North Korea
Feb 13, 2017
This chart shows the estimated ranges of North Korean missiles.
More Information
U.S.-Mexico Wall
Feb 10, 2017
This chart shows the dimensions and cost estimates for the Mexico-U.S. border fortification proposed U.S. President Donald Trump
More Information
In-room entertainment at hotels
Feb 10, 2017
This chart shows the steep decrease in in-room video rental revenue earned by U.S. hotels.
More Information
Twitter's revenue growth
Feb 9, 2017
This chart illustrates Twitter user and revenue growth.
More Information
Connected cars
Feb 9, 2017
This chart shows how much data connected cars generate per hour.
More Information
Shadow Economy
Feb 9, 2017
This chart shows the shadow economy as a percentage of GDP in selected countries in 2017.
More Information
G7
Feb 9, 2017
This chart shows the average annual real GDP growth rate of G7 countries from 2016 to 2050.
More Information
Greenhouse Gases
Feb 9, 2017
This chart shows yearly per capita CO2 emissions in selected countries (in tons)
More Information
Natural Resources
Feb 9, 2017
This chart shows the amount of coal sourced in the United States since 2001 (in million short tons)
More Information
Bluetooth headphone market share
Feb 8, 2017
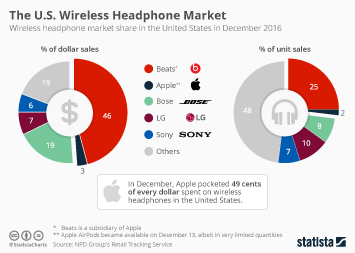
This chart shows market share figures for the U.S. wireless headphone market in December 2016.
More Information
Best Employers
Feb 8, 2017
This chart shows top Canadian employers as rated by 8,000 employees on a scale from 0.10.
More Information
U.S. Military
Feb 8, 2017
This chart shows countries where U.S. special operations forces conducted operations in 2016.
More Information
Brexit
Feb 8, 2017
This chart shows respondent's evaluation of the relationship between the UK and the EU (in %)
More Information
Finance & Credit
Feb 8, 2017
This chart shows commercial & industrial loans in the United States Dec. 2006 – 2017 (in $ billions)
More Information
Donald Trump
Feb 7, 2017
This chart shows the number of lawsuits filed against US administrations in their first 14 days.
More Information
E-Commerce
Feb 7, 2017
This chart shows the countries with the largest B2C e-commerce markets in 2015 and 2016 (in billion U.S. dollars)
More Information
E-Commerce
Feb 7, 2017
This chart shows the most important online shopping delivery elements for customers 2016
More Information
Rule of Law
Feb 6, 2017
This chart shows lawsuits against U.S. President Donald Trump and his policies broken down by topic
More Information
Democracy in the U.S.
Feb 6, 2017
This chart shows the three main branches of U.S. government
More Information
Innovation
Feb 6, 2017
This chart shows the number of patent applications per 100,000 published in 2015.
More Information
Donald Trump
Feb 6, 2017
This chart shows the % of people in the US who approve/disapprove of Trump's executive orders.
More Information
Automotive Industry
Feb 6, 2017
This chart shows auto sales by selected manufacturers in the United States 2016
More Information
Terrorism & National Security
Feb 3, 2017
This chart shows the number of victims in terror attacks by foreign-born terrorists on U.S. soil (1975 to 2015)
More Information
E-Commerce
Feb 3, 2017
This chart shows how Amazon's shipment costs have risen over the past decade.
More Information
Super Bowl
Feb 3, 2017
This chart shows what kind of goods/services Americans associate most strongly with Super Bowl commercials.
More Information
Snap files for an IPO
Feb 3, 2017
This chart compares key metrics of Snapchat, Facebook and Twitter prior to their respective IPOs.
More Information
Donald Trump
Feb 3, 2017
This chart shows the thoughts of British people on U.S. President Donald Trump right now.
More Information
STEM Graduates
Feb 3, 2017
This chart shows recent graduates in Science, Technology, Engineering and Mathematics (2016).
More Information
Sporting event tickets
Feb 2, 2017
This chart compares ticket prices for major sporting events to an average fan's annual budget for online ticket purchases.
More Information
Mobile Internet
Feb 2, 2017
This chart shows how many 4G gigabytes €30 buys on smartphones in selected EU countries
More Information
131
/
161
Contact
Get in touch with us. We are happy to help.
Do you still have questions?
Feel free to contact us anytime using our
contact form
or visit our
FAQ page
.
Your contact to the Infographics Newsroom
Felix Richter
Data Journalist
felix.richter@statista.com
+49 (40) 284 841 557