Skip to main content
Consumer Goods & FMCG
E-Commerce
Economy & Politics
Energy & Environment
Health, Pharma & Medtech
Internet
Media
Technology & Telecommunications
Transportation & Logistics
Travel, Tourism & Hospitality
View all industries
Global data volume growth
Global AI market size
Number of generative AI users worldwide
Global inflation rate
Retail e-commerce sales worldwide
Largest economies worldwide
Biggest social media platforms by users
Global EV market share by manufacturer
International tourist arrivals by world region
Global annual CO₂ emissions
Browse recent statistics
Artificial intelligence (AI) worldwide
TikTok
Nvidia
E-commerce worldwide
Global GDP
Instagram
Apparel market worldwide
Video gaming worldwide
Global renewable energy industry
Influencer marketing worldwide
Browse recent topics
Consumer Trends 2026
Artificial Intelligence: in-depth market analysis
E-commerce challenges
Global economy
TikTok
Luxury goods: in-depth market analysis
Electric vehicles: A global overview
Video gaming worldwide
Travel and tourism trends 2026
Battery recycling worldwide
Browse recent reports
Explore the tool
Explore Classic mode
Advertising & Media
eCommerce
Consumer
Finance
Global Indicators
Health
Industrial
Mobility
Technology
Explore Market Insights
eCommerce Insights
Research AI
Book a demo
All integrations
Developer docs
Explore Statista Connect
Research
Strategy & Consulting
Marketing
Media & PR
Explore AI assistants
Marketing
Research & Development
Strategy
Sales
Find the fact
Tell the story
Win the pitch
Understand the market
Develop your strategy
Academia
Agencies
Consultancies
Consumer goods
Finance
Tech
Research solutions
Strategy consulting
Communication services
Explore Statista+
Statista R
Statista Healthcare
About Statista
First steps & help center
Webinar & training hub
Success stories
Individuals & Small Teams
Businesses & Enterprises
Academia & Government
English
Deutsch
Daily Data
Global stories vividly visualized
NBA
Jul 30, 2020
This chart shows the timeline of positive COVID-19 cases among NBA players and staff.
More Information
Covid-19 Outbreak
Jul 30, 2020
This chart shows Covid-19 deaths per 100,000 people in the U.S. by race or ethnicity.
More Information
European Aerospace Industry
Jul 30, 2020
This chart shows countries that have ordered European fighter jets (as of July, 2020).
More Information
Covid-19 Outbreak
Jul 30, 2020
This chart shows states with more than 100 new Covid-19 cases per 100,000 people in the past week.
More Information
Colleges and Universities
Jul 29, 2020
This chart shows the percentage of U.S. colleges utilizing each reopening plan for fall semester.
More Information
Census
Jul 29, 2020
This chart shows the percentage of U.S. adults saying whether they or someone in their household has submitted a census form.
More Information
Amazon
Jul 29, 2020
The chart breaks down physical gross merchandise sales on Amazon, by type of seller.
More Information
Best Employers
Jul 29, 2020
This chart shows the top 10 employers as rated by U.S. employees in 2020 (grading scale 0-100).
More Information
Tourism in Spain
Jul 28, 2020
This chart shows the number of international tourist arrivals in Spain, by country of origin.
More Information
Covid-19 Outbreak
Jul 28, 2020
This chart shows the estimated share of renter households facing a rental shortfall and potential eviction.
More Information
Australia
Jul 28, 2020
This chart shows the estimated number of animals killed or displaced by the 2019 and 2020 wildfire season.
More Information
Economic Stimulus
Jul 28, 2020
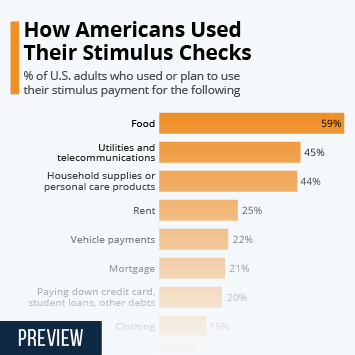
This chart shows how Americans used/planned to use the stimulus payments they received as part of the CARES Act.
More Information
Investing
Jul 28, 2020
This chart shows the correlation between gold and the U.S. dollar in 2020.
More Information
Trump Administration
Jul 27, 2020
This chart shows the share approving of the job performance of U.S leadership in selected countries.
More Information
Music Industry
Jul 27, 2020
This chart shows the artists with the most no. 1 singles on the Billboard Hot 100 charts.
More Information
Covid-19 Outbreak
Jul 27, 2020
This chart shows the estimated cost of containing future pandemic compared to Covid-19's economic damage.
More Information
Covid-19 Outbreak
Jul 27, 2020
This chart shows the countries that are developing or that have rolled out Covid-19 tracing apps.
More Information
COVID-19 Outbreak
Jul 24, 2020
This chart shows nationwide prevalence of underlying conditions in U.S. adults in 2018.
More Information
Professional Sports
Jul 24, 2020
This chart shows American sports fans' opinions on when leagues should return from coronavirus shutdowns.
More Information
Big Tech
Jul 23, 2020
This chart shows the percentage of U.S. adults who say major tech companies should be regulated more than they currently are.
More Information
Voice Assistants
Jul 23, 2020
This chart shows how many smart home devices are compatible with Alexa.
More Information
Airline Industry
Jul 23, 2020
This chart shows year-to-date stock performance of selected U.S. airlines.
More Information
United States Postal Service
Jul 23, 2020
This chart shows predicted United States Postal Service pandemic losses based on two scenarios.
More Information
U.S. Postal Service
Jul 23, 2020
This chart hows the number of postal employees attacked by dogs by city in 2019.
More Information
Stock market
Jul 22, 2020
This chart shows the percent share of the total Nasdaq 100 by market cap.
More Information
Energy consumption
Jul 22, 2020
This chart shows the search volume indices for the following electronics in 2019 and 2020.
More Information
Kanye West
Jul 22, 2020
This chart shows the share of the U.S. public who consider Kanye West's candidacy legitimate/a publicity stunt.
More Information
Covid-19 Outbreak
Jul 22, 2020
This chart shows the status of state participation in Apple & Google's Exposure Notification API*.
More Information
IBM
Jul 21, 2020
This chart shows the percent change from the previous year in IBM's quarterly revenue.
More Information
Space exploration
Jul 21, 2020
This chart shows a timeline of notable global missions to Mars.
More Information
Economic Impact of COVID-19
Jul 21, 2020
This chart shows the total contribution of travel and tourism to GDP of countries worst affected by the COVID-19 pandemic.
More Information
Demographics
Jul 20, 2020
This chart shows the share of babies born outside of marriage in EU countries.
More Information
Voice Platforms
Jul 20, 2020
This chart shows leading voice platforms worldwide based on Voicebot's Voice Platform Impact Rating.
More Information
Advertising
Jul 20, 2020
This chart shows leading advertisers in the United States, based on total U.S. ad spending in 2019.
More Information
COVID-19
Jul 20, 2020
This chart shows the percentage of people saying the cost of food, groceries and household supplies has increased since COVID-19.
More Information
Disposable Incomes
Jul 17, 2020
This chart shows the average disposable income of the top and bottom 20 percent of earners in China.
More Information
Retail
Jul 17, 2020
This chart shows the percent change from the previous month in U.S. retail sales figures for 2020.
More Information
COVID-19
Jul 17, 2020
This chart shows how often Americans use face masks in public, in percent.
More Information
Twitter Hack
Jul 16, 2020
This chart shows the largest Twitter accounts compromised in the hack on July 15, 2020, by number of followers.
More Information
Banking
Jul 16, 2020
This chart shows loan-loss provisions among major U.S. banks over the last three quarters (in million U.S. dollars).
More Information
Unemployment
Jul 16, 2020
This chart shows the percent change in unemployment since December 2019, by education and age.
More Information
Earnings
Jul 16, 2020
This chart shows some quick facts from Wells Fargo's Q2 2020 earnings report.
More Information
COVID-19
Jul 16, 2020
This chart shows the average new cases a day in the past week and percent change from two weeks ago by U.S. state.
More Information
College & COVID
Jul 16, 2020
This chart shows U.S. college students' responses about lifestyle if colleges reopen in the fall.
More Information
Police Violence
Jul 15, 2020
Number of people killed in police shootings in the U.S. since January 01, 2015.
More Information
Advertising
Jul 15, 2020
This chart shows the split between digital and traditional spending for advertising in the U.S. from 2017-2024.
More Information
European Commission vs. Apple
Jul 15, 2020
THis chart shows how much Apple paid in income taxes outside the United States between 2003 and 2019.
More Information
Death Penalty
Jul 15, 2020
This chart shows the number of executions by U.S. state between 1609-2020.
More Information
Purchasing Power
Jul 14, 2020
This chart shows the countries with the biggest purchasing powers in 2020 and 2060 (projected).
More Information
COVID-19 Pandemic
Jul 14, 2020
This chart shows the status of U.S. state reopenings as of July 13, 2020.
More Information
Investing
Jul 13, 2020
This chart shows foreign investors' holdings of Chinese government bonds (in billion yuan).
More Information
Social Media
Jul 13, 2020
This chart shows the percentage of social media users who say each aspect of social media is important to them.
More Information
Economy
Jul 10, 2020
This chart shows the tax havens with the most artificially shifted profits from high-tax countries in 2017.
More Information
Property Prices
Jul 10, 2020
This chart shows the price of the average apartment in selected Korean cities (2017 and 2020).
More Information
GDP
Jul 10, 2020
This chart shows the biggest economies in the world by GDP (current prices/PPP) in 2019 and their growth prospects in 2020.
More Information
Airline Industry
Jul 10, 2020
This chart shows the U.S. share of airline capacity by number of available seats (in millions).
More Information
Public Opinion
Jul 9, 2020
This chart shows the percentage of U.S. adults who believe spending on policing should increase, decrease or stay the same.
More Information
Public Opinion
Jul 9, 2020
This chart shows the percentage of U.S. adults who believe police spending should decrease, increase or stay the same.
More Information
Public Opinion
Jul 9, 2020
This chart shows the percentage of Republicans who believe racial discrimination in the U.S. is a big problem or not a problem.
More Information
Artificial Intelligence
Jul 9, 2020
This chart shows how many artificial intelligence startups selected tech companies have acquired since 2010.
More Information
CEO Ranking
Jul 9, 2020
This chart shows the best-performing CEOs in 2019 as ranked by Harvard Business Review.
More Information
Economic Impact of COVID-19
Jul 9, 2020
This chart shows the share of U.S. adults whose household incomes had been negatively affected/not negatively affected by the COVID-19...
More Information
Digitization
Jul 9, 2020
This chart shows the estimated number of U.S. households with smart applications in 2020 and 2024, by type.
More Information
Manufacturing
Jul 9, 2020
This chart shows the decline of manufacturing value added as a percent of GDP in major economies (1980-2019).
More Information
Jobs
Jul 8, 2020
This chart shows the unemployment rates by industry and class of worker for June 2020.
More Information
Unemployment
Jul 8, 2020
This chart shows labor force unemployment in selected OECD countries in February and May of 2020.
More Information
E-Commerce
Jul 8, 2020
This chart shows the value of e-commerce consumer expenditure in Japan in 2020, by category (billion U.S. dollars).
More Information
E-Cigarettes
Jul 8, 2020
This chart shows the percent of survey respondents who (also) use e-cigarettes or vapes, per country. (2020)
More Information
MLB
Jul 8, 2020
This chart shows the price of a hot dog in the MLB by team in 2019.
More Information
PPP Loans
Jul 7, 2020
This chart shows the Paycheck Protection Program coronavirus relief loans approved thru June 30, 2020 by size (in percent).
More Information
Pandemic
Jul 7, 2020
This chart maps a forecast of year-on-year real GDP change in Europe in 2020.
More Information
Europe
Jul 7, 2020
This chart shows the number of UK citizens acquiring German citizenship from 2000 to 2019.
More Information
United Kingdom
Jul 7, 2020
This chart shows the share of 8 to 15 year olds in Great Britain saying they normally listen to music using certain mediums.
More Information
Film Score
Jul 7, 2020
This chart shows some quick facts on the illustrious career of Italian composer Ennio Morricone.
More Information
Digital Payments
Jul 7, 2020
This chart shows the market capitalization of digital-payment company Square in 2020 (in billions).
More Information
Food Delivery
Jul 7, 2020
This chart shows the percentage of total delivery sales made by each food delivery company in May 2020.
More Information
Facebook
Jul 6, 2020
This chart shows the advertising revenue and spending by category for Facebook (in millions).
More Information
Coin Shortage
Jul 6, 2020
This chart shows the U.S. Mint's annual coin production for circulation from 2016-2020 (projected).
More Information
Start-ups
Jul 6, 2020
This chart shows in which countries the world's 'unicorns' are, as of June 2020.
More Information
Unicorns
Jul 6, 2020
This chart shows the cities home to most unicorn companies in the world as of June 2020.
More Information
Auto Industry
Jul 6, 2020
This chart compares new car registrations in the United Kingdom as of June 2019 and 2020.
More Information
Waste-to-Energy
Jul 6, 2020
This chart shows the renewable energy mix in South Korea (2012-2035).
More Information
Real Estate
Jul 6, 2020
This chart shows some quick facts on the second quarter sales of apartments in Manhattan, New York, in 2020.
More Information
Global Middle Class
Jul 3, 2020
This chart shows the share (in percent) of the global middle class by region in 2020 and 2030 (projection).
More Information
Made in India
Jul 3, 2020
This chart shows consumer attitudes towards products made in India (2020).
More Information
Environment
Jul 3, 2020
This chart shows the amount of forest area restored from 200o to 2019, by world region.
More Information
Social Media
Jul 3, 2020
This chart shows monthly active users of selected social networks and messaging services.
More Information
U.S. Job Market
Jul 3, 2020
This chart shows the change in total private nonfarm payroll employment in June 2020, by industry.
More Information
U.S. Labor Market
Jul 3, 2020
This chart shows the share of the U.S. civilian noninstitutional population (16 years and over) that is currently employed.
More Information
Media
Jul 2, 2020
This chart shows the share of people in selected countries that listen to podcasts on a weekly basis in 2019 and 2020.
More Information
76
/
161
Contact
Get in touch with us. We are happy to help.
Do you still have questions?
Feel free to contact us anytime using our
contact form
or visit our
FAQ page
.
Your contact to the Infographics Newsroom
Felix Richter
Data Journalist
felix.richter@statista.com
+49 (40) 284 841 557