Skip to main content
Consumer Goods & FMCG
E-Commerce
Economy & Politics
Energy & Environment
Health, Pharma & Medtech
Internet
Media
Technology & Telecommunications
Transportation & Logistics
Travel, Tourism & Hospitality
View all industries
Global data volume growth
Global AI market size
Number of generative AI users worldwide
Global inflation rate
Retail e-commerce sales worldwide
Largest economies worldwide
Biggest social media platforms by users
Global EV market share by manufacturer
International tourist arrivals by world region
Global annual CO₂ emissions
Browse recent statistics
Artificial intelligence (AI) worldwide
TikTok
Nvidia
E-commerce worldwide
Global GDP
Instagram
Apparel market worldwide
Video gaming worldwide
Global renewable energy industry
Influencer marketing worldwide
Browse recent topics
Consumer Trends 2026
Artificial Intelligence: in-depth market analysis
E-commerce challenges
Global economy
TikTok
Luxury goods: in-depth market analysis
Electric vehicles: A global overview
Video gaming worldwide
Travel and tourism trends 2026
Battery recycling worldwide
Browse recent reports
Explore the tool
Explore Classic mode
Advertising & Media
eCommerce
Consumer
Finance
Global Indicators
Health
Industrial
Mobility
Technology
Explore Market Insights
eCommerce Insights
Research AI
Book a demo
All integrations
Developer docs
Explore Statista Connect
Research
Strategy & Consulting
Marketing
Media & PR
Explore AI assistants
Marketing
Research & Development
Strategy
Sales
Find the fact
Tell the story
Win the pitch
Understand the market
Develop your strategy
Academia
Agencies
Consultancies
Consumer goods
Finance
Tech
Research solutions
Strategy consulting
Communication services
Explore Statista+
Statista R
Statista Healthcare
About Statista
First steps & help center
Webinar & training hub
Success stories
Individuals & Small Teams
Businesses & Enterprises
Academia & Government
English
Deutsch
Daily Data
Infographics on the topic "coronavirus"
Covid-19 Pandemic
Dec 1, 2020
This chart shows the number of doses of Covid-19 vaccines secured by the U.S. as of November 20, 2020.
More Information
Covid-19 Pandemic
Dec 1, 2020
This chart shows the reported cost per dose of selected Covid-19 vaccine candidates.
More Information
Thanksgiving Travel
Nov 30, 2020
This chart shows total traveler throughput at U.S. airports in 2020 compared to the same period in 2019.
More Information
Covid-19
Nov 26, 2020
This infographic shows the number of cars manufactured in the United Kingdom in March of 2019 and 2020.
More Information
Economy
Nov 25, 2020
This chart shows the forecast public sector net borrowing of the UK.
More Information
UK
Nov 24, 2020
This chart shows the results of a survey into who the UK public think would make the best prime minister in November 2020.
More Information
Eviction crisis
Nov 23, 2020
This chart shows the percentage of U.S. adults who have the following confidence level in their ability to make next month's rent payment.
More Information
Retail
Nov 23, 2020
This chart shows forecast annual changes in Black Friday footfall in the UK in 2020, by retail destination.
More Information
COVID-19 Vaccine
Nov 19, 2020
This chart shows the year-to-date stock performance of frontrunners in the race to develop a COVID-19 vaccine.
More Information
Higher education
Nov 19, 2020
This chart shows the percentage of global postdocs who said their job satisfaction has improved/worsened over the last year.
More Information
Media
Nov 16, 2020
This chart shows the projected global video-on-demand revenue in 2019 and 2020, by type.
More Information
Covid-19
Nov 16, 2020
This chart shows the change in active job postings in the UK from March to October 2020, by region.
More Information
COVID-19 Pandemic
Nov 13, 2020
This chart shows countries that have not reported COVID-19 cases.
More Information
Coronavirus
Nov 13, 2020
This chart shows the number of daily new COVID-19 cases in the U.S.
More Information
COVID-19
Nov 13, 2020
This chart shows the percent change of the 7-day average of new COVID-19 cases in the U.S.
More Information
Diseases
Nov 13, 2020
This chart shows the number of reported measles cases across the world for each year.
More Information
Economy
Nov 11, 2020
This chart shows the YOY change in employment rates across Europe in Q2 2020.
More Information
Covid-19 Outbreak
Nov 11, 2020
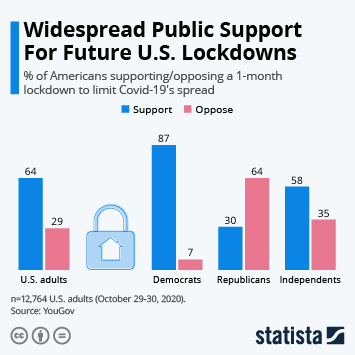
This chart shows the share of Americans supporting/opposing a 1-month lockdown.
More Information
COVID-19 Vaccine
Nov 10, 2020
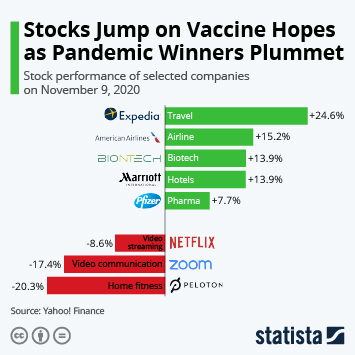
This chart shows the stock performance of selected companies on November 9, 2020 after Pfizer and BioNTech had announced progress in...
More Information
Motorcycles
Nov 10, 2020
This chart shows the year-over-year change in monthly motorcycle sales in selected Asian countries in 2019 and 2020.
More Information
COVID-19 Outbreak
Nov 10, 2020
This chart shows the number of Covid-19 vaccine candidates by developmental phase.
More Information
Coronavirus
Nov 5, 2020
This chart shows the countries with the highest number of confirmed COVID-19 cases per one million population.
More Information
2020 Election
Nov 3, 2020
This chart shows survey answers on how Democrats/Republicans were planning to vote in the 2020 U.S. presidential elections.
More Information
2020 Presidential Election
Nov 3, 2020
This chart shows what Americans are concerned about ahead of the 2020 presidential election.
More Information
Real Estate
Nov 2, 2020
This chart shows the percent change from a year ago in contracts to buy homes/apartments.
More Information
2020 Election
Nov 2, 2020
This chart shows the number of total votes and votes cast early in U.S. presidential elections (in millions).
More Information
iPhone
Oct 30, 2020
This chart shows iPhone revenue as a percentage of Apple's total revenue since 2007.
More Information
Tourism
Oct 30, 2020
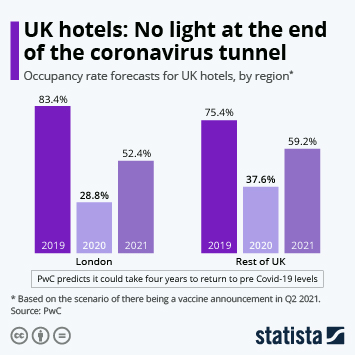
This chart shows UK hotel occupancy forecasts from 2019 to 2021.
More Information
Health
Oct 29, 2020
This chart shows available hospital beds per 100,000 inhabitants in the EU in 2018.
More Information
Transportation
Oct 29, 2020
This chart shows 2020 passenger numbers at Europe's busiest airports as of 30 September and year-on-year change.
More Information
UK
Oct 28, 2020
This chart shows the share of furloughed workers in the UK that have since lost their jobs entirely.
More Information
COVID-19
Oct 28, 2020
This chart shows the percentage of people around the world who would accept a COVID-19 vaccine.
More Information
Retail
Oct 28, 2020
This chart shows the average amount of money Americans plan on spending for Christmas each year, measured in October.
More Information
2020 Election
Oct 20, 2020
This chart compares the share of U.S. adults saying they are 'better off' under recent presidents.
More Information
Korean Entertainment Industry
Oct 16, 2020
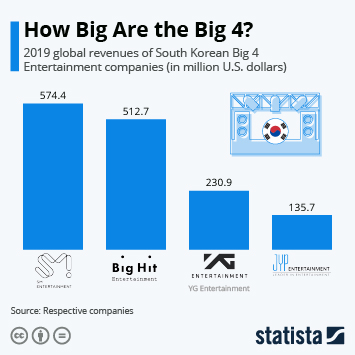
This chart shows the 2019 revenues of the Korean entertainment companies dubbed the Big 4.
More Information
Pandemic
Oct 16, 2020
This chart shows the annual change in CO2 emissions around the world in 2020.
More Information
Covid-19 Pandemic
Oct 15, 2020
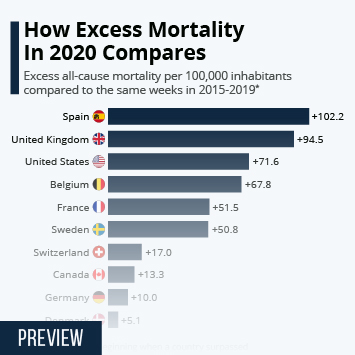
This chart shows excess all-cause mortality per 100,000 inhabitants compared to the same weeks in 2015-2019.
More Information
COVID-19
Oct 13, 2020
This chart shows the IMF's global GDP growth forecasts published before and during the COVID-19 pandemic.
More Information
U.S. Politics
Oct 13, 2020
This chart shows the share of U.S. registered voters who consider the following...
More Information
Halloween
Oct 8, 2020
This chart shows the percentage of U.S. adults who plan to wear Halloween costumes this year compared to those who dressed up last...
More Information
Unemployment
Oct 8, 2020
This chart shows the monthly net store openings in the U.S. in 2020.
More Information
Unemployment
Oct 8, 2020
This chart shows the number of new eating and drinking jobs created in the U.S. relative to the previous month in 2020.
More Information
COVID-19
Oct 8, 2020
This chart shows the countries and regional economies with the biggest billionaire wealth in 2019 and 2020 (in trillion U.S. dollars).
More Information
Politics
Oct 8, 2020
This infographic charts the popularity of German Chancellor Merkel over her 15 years in power.
More Information
2020 Election
Oct 8, 2020
This chart shows minutes spoken in the October 07, 2020 televised vice presidential debate.
More Information
Unemployment
Oct 7, 2020
This chart shows the monthly change in new payroll employment in 2020.
More Information
Flu Season
Oct 7, 2020
This chart shows the estimated number of deaths due to influenza in the U.S. by season.
More Information
Coronavirus
Oct 6, 2020
This chart shows the share of U.S. adults that say they are scared to some degree of contracting Covid-19.
More Information
Covid-19 Outbreak
Oct 6, 2020
This chart shows the rate of Covid-19 cases per 100,000 residents in U.S. states.
More Information
Unemployment
Oct 5, 2020
This chart shows the number of U.S. workers who are on or are waiting for unemployment benefits.
More Information
2020 Election
Oct 5, 2020
This chart shows the percentage of U.S. voters from each party who said each issue is important for their vote.
More Information
Covid-19 Outbreak
Oct 5, 2020
This chart shows the share of Covid-19 misinformation in the media identified as the following conspiracy theories.
More Information
Cycling
Oct 2, 2020
This chart shows extra kilometers of cycling measures announced/implemented in the EU during the pandemic.
More Information
Halloween
Sep 29, 2020
This chart shows the percentage of U.S. adults who plan to allow their children to trick-or-treat this Halloween.
More Information
Trade Shows
Sep 29, 2020
This chart shows revenue from business spending on trade show exhibitions in the United States.
More Information
Coffee
Sep 29, 2020
This chart shows the average price for a cappuccino in different cities in 2019.
More Information
Teacher wages
Sep 28, 2020
This chart shows the percent difference in weekly wages for K-12 public school teachers compared to nonteaching, college-educated peers.
More Information
COVID-19
Sep 25, 2020
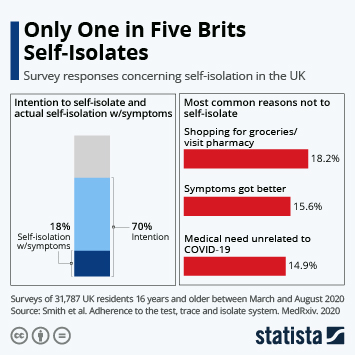
This chart shows the number of Brits intending to self-isolate when experiencing COVID-19 like symptoms and the number of Brits actually...
More Information
Chuseok Fall Festival
Sep 25, 2020
This chart shows the share of Korean office workers who said they would not visit their hometowns for the Chuseok fall festival (2016-2021).
More Information
Streaming
Sep 23, 2020
This chart shows the market share of streaming (OTT) platforms in India in Q2 2020.
More Information
COVID-19
Sep 22, 2020
This chart shows the projected increase of business insolvencies in 2021 compared with 2019 (in percent).
More Information
Covid-19 Outbreak
Sep 22, 2020
This chart shows countries with country-wide or localized school closures (as of Sept 21, 2020).
More Information
COVID-19 Outbreak
Sep 21, 2020
This chart shows total federal spending on major Covid-19 programs by state.
More Information
TV vs. Streaming
Sep 18, 2020
This chart shows the estimated revenue change of TV & video products in 2020 compared to 2019 (in percent).
More Information
Covid-19 Outbreak
Sep 18, 2020
This chart shows responses to the question: "What is the best way for states to deal with the coronavirus moving forward?"
More Information
Health
Sep 18, 2020
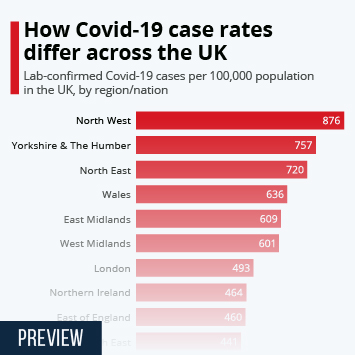
This chart shows the rate of Covid-19 cases per 100,000 population in UK regions and nations.
More Information
Economy
Sep 16, 2020
This chart shows the percentage of U.S. voters who say the economy is either recovering, worsening or not changing.
More Information
Japanese Diet
Sep 16, 2020
This chart shows the share of votes by party in the upper and lower house of the Japanese Diet after the opposition party merger of...
More Information
Japan Store Sales
Sep 16, 2020
This chart shows total monthly sales in Japanese supermarkets, convenience stores and department stores in 2019 and 2020.
More Information
U.S. Election
Sep 16, 2020
This chart shows the most important issues for Biden and Trump supporters when voting in 2020.
More Information
Covid-19 outbreak
Sep 16, 2020
This chart shows the share of the public saying the U.S. has done a bad/good job dealing with coronavirus.
More Information
Economy
Sep 16, 2020
This chart shows projected changes to GDP in 2020 in selected countries.
More Information
United States
Sep 16, 2020
This chart shows the share of the public with a favorable view of the United States.
More Information
COVID-19
Sep 15, 2020
This chart shows the new COVID-19 cases each week among U.S. prisoners.
More Information
2020 Election
Sep 15, 2020
This chart shows the percentage of U.S. voters who say each issue is the most important when voting for president.
More Information
2020 Election
Sep 15, 2020
This chart shows the percentage of U.S. voters who say each issue is the most important when voting for president.
More Information
Internet accessibility
Sep 14, 2020
This chart shows the percentage of parents who encounter at least one of each obstacle for their child completing remote schoolwork.
More Information
Global economy
Sep 14, 2020
This chart shows the percent growth from the previous month in GDP for 2020 for the U.K. and Norway.
More Information
TikTok
Sep 14, 2020
This chart shows global monthly downloads of TikTok, Instagram and Facebook on the Android and Apple app stores in 2020.
More Information
COVID-19
Sep 11, 2020
This chart shows global confirmed COVID-19 cases, split up in active cases, recovered and deceased patients (2020).
More Information
COVID-19 in Japan
Sep 11, 2020
This chart shows countries from where travel to Japan is banned due to the COVID-19 pandemic (as of September 11, 2020).
More Information
Instant Noodles
Sep 10, 2020
This chart shows instant noodle consumption per capita and in total in selected countries in 2019.
More Information
Economic Sectors
Sep 10, 2020
This chart shows economic sectors as a share of China's GDP between 1960 ans 2019.
More Information
European Union
Sep 10, 2020
This chart shows the estimated VAT gap in the European Union in 2018.
More Information
American Football
Sep 10, 2020
This chart shows what football fans think about the possible start of the football season in the fall.
More Information
Covid-19
Sep 10, 2020
this chart shows the estimated number of preventable U.S. Covid-19 deaths if control measures had been implemented earlier.
More Information
COVID-19 Impact on Everyday Life
Sep 9, 2020
This chart shows total vehicle miles traveled on all roads and streets in the U.S.
More Information
Internet access
Sep 8, 2020
This chart shows the percentage of people with access to the internet based on economic vulnerability.
More Information
Fitness
Sep 8, 2020
This chart shows the annual sales of Peloton bike equipment and digital content (in million U.S. dollars).
More Information
Covid-19 Outbreak
Sep 7, 2020
This chart shows the number of confirmed Covid-19 cases at universities as of September 02, 2020.
More Information
9
/
15
Contact
Get in touch with us. We are happy to help.
Do you still have questions?
Feel free to contact us anytime using our
contact form
or visit our
FAQ page
.
Your contact to the Infographics Newsroom
Felix Richter
Data Journalist
felix.richter@statista.com
+49 (40) 284 841 557