Skip to main content
Consumer Goods & FMCG
E-Commerce
Economy & Politics
Energy & Environment
Health, Pharma & Medtech
Internet
Media
Technology & Telecommunications
Transportation & Logistics
Travel, Tourism & Hospitality
View all industries
Global data volume growth
Global AI market size
Number of generative AI users worldwide
Global inflation rate
Retail e-commerce sales worldwide
Largest economies worldwide
Biggest social media platforms by users
Global EV market share by manufacturer
International tourist arrivals by world region
Global annual CO₂ emissions
Browse recent statistics
Artificial intelligence (AI) worldwide
TikTok
Nvidia
E-commerce worldwide
Global GDP
Instagram
Apparel market worldwide
Video gaming worldwide
Global renewable energy industry
Influencer marketing worldwide
Browse recent topics
Consumer Trends 2026
Artificial Intelligence: in-depth market analysis
E-commerce challenges
Global economy
TikTok
Luxury goods: in-depth market analysis
Electric vehicles: A global overview
Video gaming worldwide
Travel and tourism trends 2026
Battery recycling worldwide
Browse recent reports
Explore the tool
Explore Classic mode
Advertising & Media
eCommerce
Consumer
Finance
Global Indicators
Health
Industrial
Mobility
Technology
Explore Market Insights
eCommerce Insights
Research AI
Book a demo
All integrations
Developer docs
Explore Statista Connect
Research
Strategy & Consulting
Marketing
Media & PR
Explore AI assistants
Marketing
Research & Development
Strategy
Sales
Find the fact
Tell the story
Win the pitch
Understand the market
Develop your strategy
Academia
Agencies
Consultancies
Consumer goods
Finance
Tech
Research solutions
Strategy consulting
Communication services
Explore Statista+
Statista R
Statista Healthcare
About Statista
First steps & help center
Webinar & training hub
Success stories
Individuals & Small Teams
Businesses & Enterprises
Academia & Government
English
Deutsch
Daily Data
Infographics on the topic "coronavirus"
Tourism
Feb 9, 2021
This chart presents key figures from the TUI Group Q1 2021 financial statements.
More Information
Labor Force Participation
Feb 8, 2021
This chart shows the change in the labor force participation rate of men and women of different races/ethnicites in the U.S. in 2020.
More Information
Coronavirus
Feb 8, 2021
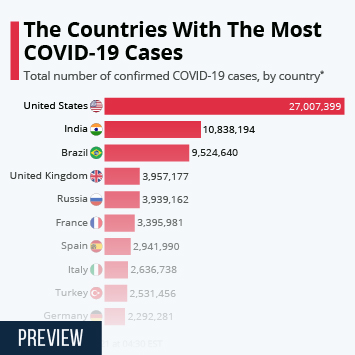
This chart shows the countries with the largest number of confirmed Covid-19 cases.
More Information
World's Longest Flights
Feb 8, 2021
This chart shows the longest non-stop flights in the world.
More Information
Carbon emissions
Feb 3, 2021
This chart shows the percent change in annual carbon emissions in 2020.
More Information
Covid-19 Pandemic
Feb 3, 2021
This chart shows the demographic characteristics of people vaccinated against Covid-19.
More Information
Society
Feb 3, 2021
This chart compares levels of recorded crime before and during lockdown in the UK.
More Information
Covid-19 Pandemic
Feb 2, 2021
This chart shows Israeli study results of people vaccinated against Covid-19 and subsequent infections.
More Information
Covid-19 Outbreak
Feb 2, 2021
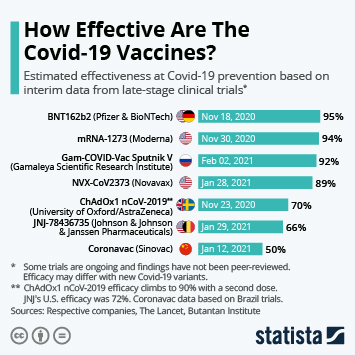
This chart shows the estimated effectiveness of Covid-19 vaccines based on interim data from late-stage clinical trials.
More Information
Aviation
Feb 2, 2021
This chart compares selected KPIs of Ryanair in Q3 2021 and 2020.
More Information
Car Markets
Jan 29, 2021
This chart shows new passenger car registrations by country in 2020 and the change since 2019.
More Information
COVID-19 crisis
Jan 29, 2021
This chart shows the global demand in gold (in tons).
More Information
Immigration
Jan 29, 2021
This chart shows the percentage of U.S. adults who support/oppose a 100-day ban on deportations in the country.
More Information
COVID-19
Jan 27, 2021
This chart shows the daily new cases of COVID-19 in China and South Korea between February 2020 and February 2021.
More Information
GNI
Jan 27, 2021
This chart shows gross national income by capita in selected countries in 2019.
More Information
Pandemic
Jan 27, 2021
This chart shows the seven-day rolling average number of deaths in the UK within 28 days of a positive Covid-19 test.
More Information
Covid-19 Kuenssberg
Jan 27, 2021
This chart shows the number of confirmed deaths due to the coronavirus in the UK.
More Information
Corporate Debt
Jan 26, 2021
This chart shows the corporate debt level by country in Q2 2019 and Q2 2020.
More Information
Super Bowl
Jan 26, 2021
This chart shows the average price of resold tickets for the Super Bowl since 2014.
More Information
COVID-19 Impact
Jan 26, 2021
This chart shows new passenger car/light vehicle sales in China, the United States and the European Union.
More Information
Covid-19 Outbreak
Jan 26, 2021
This chart shows the share who agree/disagree they would take a Covid-19 vaccine if it was available.
More Information
Society
Jan 26, 2021
This chart shows the increase in calls re. children and domestic violence to the UK charity NSPCC during the Covid-19 pandemic.
More Information
Stock market
Jan 25, 2021
This chart shows the percent average initial return after SPAC IPOs in the U.S., 2003-2020.
More Information
Foreign Direct Investment
Jan 25, 2021
This chart shows the change in foreign direct investment inflow between 2019 and 2020 in selected regions and countries.
More Information
Foreign Direct Investment
Jan 25, 2021
This graphic shows foreign direct investment inflows to the U.S. and China since 2014.
More Information
Face Masks
Jan 21, 2021
This chart shows the percentage of U.S. adults saying they wear a mask when in public places.
More Information
Excess deaths
Jan 20, 2021
This chart shows the percentage of additional deaths in 2020 compared to average monthly deaths in 2016-2019.
More Information
Tourism
Jan 20, 2021
This chart shows the annual number of international visitors to Japan.
More Information
Coronavirus
Jan 19, 2021
This chart shows locations by number of confirmed COVID-19 cases.
More Information
COVID-19
Jan 18, 2021
This chart shows the confirmed COVID-19 cases per one million population in selected countries.
More Information
Soccer
Jan 18, 2021
This chart shows the year-over-year change in operating revenue of selected soccer clubs (2019/20 season)
More Information
Coronavirus
Jan 15, 2021
This chart shows the number of confirmed Covid-19 patients in UK hospitals.
More Information
E-Commerce
Jan 15, 2021
This chart shows e-commerce as share of all retail commerce selected countries (2014-2020).
More Information
Transport
Jan 15, 2021
This chart shows the most congested cities in China in 2020.
More Information
Coronavirus vaccine
Jan 12, 2021
This chart shows the percentage of U.S. adults who feel each sentiment toward the COVID-19 vaccine rollout.
More Information
Crime
Jan 12, 2021
This chart shows the percentage change in homicides in selected U.S. cities between 2019 and 2020.
More Information
Natural Disasters
Jan 12, 2021
This chart shows the natural disasters which claimed most lives in 2020.
More Information
Unemployment
Jan 11, 2021
This chart shows the number of U.S. workforce unemployed or experiencing pay/hour cuts (in millions).
More Information
Travel
Jan 11, 2021
This chart shows the YOY change in traffic volumes of Heathrow airport in 2020.
More Information
COVID-19 Vaccine
Jan 11, 2021
This chart shows the share of respondents in selected countries who said that they would get a COVID-19 vaccine if available (in percent).
More Information
COVID-19 Vaccine
Jan 8, 2021
This chart shows the coronavirus vaccine production capabilities by country for 2020 and 2021 (in billion doses).
More Information
Economy
Jan 8, 2021
This chart shows UK CFOs biggest priorities for their business in 2021.
More Information
Return to Normal after COVID-19
Jan 8, 2021
This chart shows the percentage of U.S. adults who said they're currently uncomfortable doing the following.
More Information
U.S. Manufacturing Sector
Jan 7, 2021
This chart shows the change in value of U.S. manufacturers' shipments in 2020.
More Information
Bankruptcy
Jan 6, 2021
This chart shows the number of annual U.S. bankruptcy filings, 2008-2020.
More Information
Populations
Jan 6, 2021
This chart shows the percentage of U.S. adults who said they'd prefer to live in a small-town/rural area.
More Information
Spanish Tourism
Jan 5, 2021
This chart shows international tourist expenditure in Spain from January through November of the respective year.
More Information
Covid-19 Pandemic
Jan 5, 2021
This chart shows estimated U.S. healthcare worker deaths in the pandemic by occupation.
More Information
WFH in India
Jan 5, 2021
This chart shows survey responses about working from home among urban Indian millennials (Oct/Nov 2020).
More Information
Covid-19 Pandemic
Jan 5, 2021
This chart shows U.S. healthcare worker deaths from Covid-19 by country of origin up to December 23, 2020.
More Information
Coronavirus
Jan 4, 2021
This chart shows the influence the coronavirus outbreak had on selected Asian stock indices (2020/21).
More Information
Covid-19 pandemic
Jan 4, 2021
This chart shows the cumulative number of reported vaccinations against Covid-19 in German federal states.
More Information
Car Sales
Dec 23, 2020
This chart shows the development of car production, domestic sales and exports in Japan (2019-2020).
More Information
Society
Dec 22, 2020
This chart reveals the Christmas plan/behaviour changes in the U.S. in 2020. the changes people are making to their holiday plans...
More Information
COVID-19 Stimulus
Dec 22, 2020
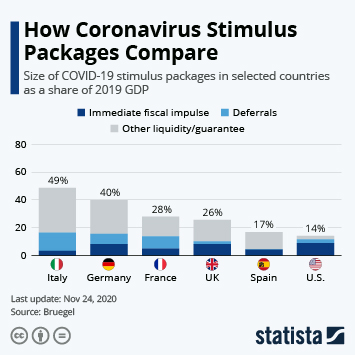
This chart show stimulus packages passed because of the coronavirus pandemic in selected countries (2020).
More Information
Economic Impact of COVID-19
Dec 22, 2020
This chart shows the year-on-year change in monthly car sales in China.
More Information
COVID-19 in India
Dec 22, 2020
This chart shows the distribution of COVID-19 cases and deaths among different cities and states in India (as of December 21, 2020).
More Information
Stimulus
Dec 22, 2020
This chart shows the percentage of U.S. adults that would use a $600 stimulus check in the following ways.
More Information
Coronavirus
Dec 18, 2020
This chart shows world leaders who have tested positive for Covid-19.
More Information
COVID-19
Dec 17, 2020
This chart shows the percentage of U.S. adults who would/would not get a COVID-19 vaccine if it was free and deemed safe by scientists.
More Information
Coronavirus
Dec 16, 2020
This chart shows effects on consumer spending in South Korea due to the second and third waves of coronavirus, by sector (2020).
More Information
Society
Dec 16, 2020
This chart reveals the Christmas plan/behaviour changes in the UK in 2020.
More Information
Coronavirus vaccine
Dec 16, 2020
This chart shows the percentage of U.S. groups who are most hesitant toward the COVID-19 vaccine.
More Information
Coronavirus vaccine
Dec 16, 2020
This chart shows the percentage of U.S. adults who would/would not get a COVID-19 vaccine if it was free and deemed safe by scientists.
More Information
Remote work
Dec 16, 2020
This chart shows the percentage of U.S. work teams/departments that plan to work remotely in five years, compared to pre-pandemic.
More Information
Restaurant Industry
Dec 14, 2020
This chart shows key figures illustrating the impact of the COVID-19 pandemic on the U.S. restaurant industry.
More Information
Review
Dec 11, 2020
A 2020 review in numbers.
More Information
"Person of the Year"
Dec 10, 2020
This chart shows recipients of Time magazine's "Person of the Year" title, by category.
More Information
Google Searches
Dec 10, 2020
This chart shows the most common search terms on Google in the U.S. in 2020.
More Information
Health
Dec 10, 2020
This chart looks at the share of Covid-19 vaccines purchased by wealth nations.
More Information
Internet
Dec 10, 2020
This chart shows the search terms which had the largest increases in 2020 compared to 2019.
More Information
Covid-19 Pandemic
Dec 10, 2020
This chart shows ICU occupancy rates at or above 100% in U.S. hospital service areas with high populations*
More Information
Pandemic
Dec 9, 2020
This chart shows the year-on-year change in ticket revenue for UK performing arts venues in 2020.
More Information
Etsy
Dec 9, 2020
This chart shows Etsy's global gross merchandise sales.
More Information
Unemployment
Dec 9, 2020
This chart shows the number of continued work-sharing claims made in the U.S. in 2020.
More Information
Airbnb IPO
Dec 8, 2020
This chart shows monthly gross booking value on Airbnb.
More Information
Unemployment
Dec 8, 2020
This chart shows the percentage of U.S. adults whose unemployment benefits end during each time frame.
More Information
Coronavirus
Dec 8, 2020
This chart shows the percentage of U.S. adults who describe their mental health in "excellent" condition.
More Information
Higher Ed
Dec 4, 2020
This chart shows survey responses to the question "In five years, how do you think higher education will be carried out in your country?"
More Information
COVID-19 deaths by age
Dec 4, 2020
This chart shows the distribution of COVID-19 deaths and the total population in the United States by age group.
More Information
Box Office
Dec 4, 2020
This chart shows weekly box office earnings in the North America in 2020.
More Information
Wages in the United States
Dec 3, 2020
This chart shows average weekly earnings of all private sector employees in the United States.
More Information
Covid-19
Dec 3, 2020
This chart shows the vaccination timeline for the Pfizer/BioNTech Covid-19 BNT162b2 vaccine.
More Information
Consumer Prices
Dec 2, 2020
This chart shows the monthly growth of consumer prices in South Korea.
More Information
Slack
Dec 2, 2020
This chart shows paid customers of Slack at the end of the respective period.
More Information
Health
Dec 2, 2020
This chart shows the number of confirmed doses of Covid-19 vaccines secured by the UK.
More Information
Coronavirus
Dec 2, 2020
This chart shows the percentage of U.S. workers working from the office in 2020.
More Information
Coronavirus
Dec 2, 2020
This chart shows the percentage of U.S. adults who have plans to travel recreationally in the next 12 months.
More Information
Markets
Dec 2, 2020
This chart shows the number of S&P 500 stocks contributing to market gains in 2020, by month.
More Information
Covid-19 Pandemic
Dec 1, 2020
This chart shows the total number of Covid-19 vaccine doses secured as of November 20, 2020.
More Information
8
/
15
Contact
Get in touch with us. We are happy to help.
Do you still have questions?
Feel free to contact us anytime using our
contact form
or visit our
FAQ page
.
Your contact to the Infographics Newsroom
Felix Richter
Data Journalist
felix.richter@statista.com
+49 (40) 284 841 557