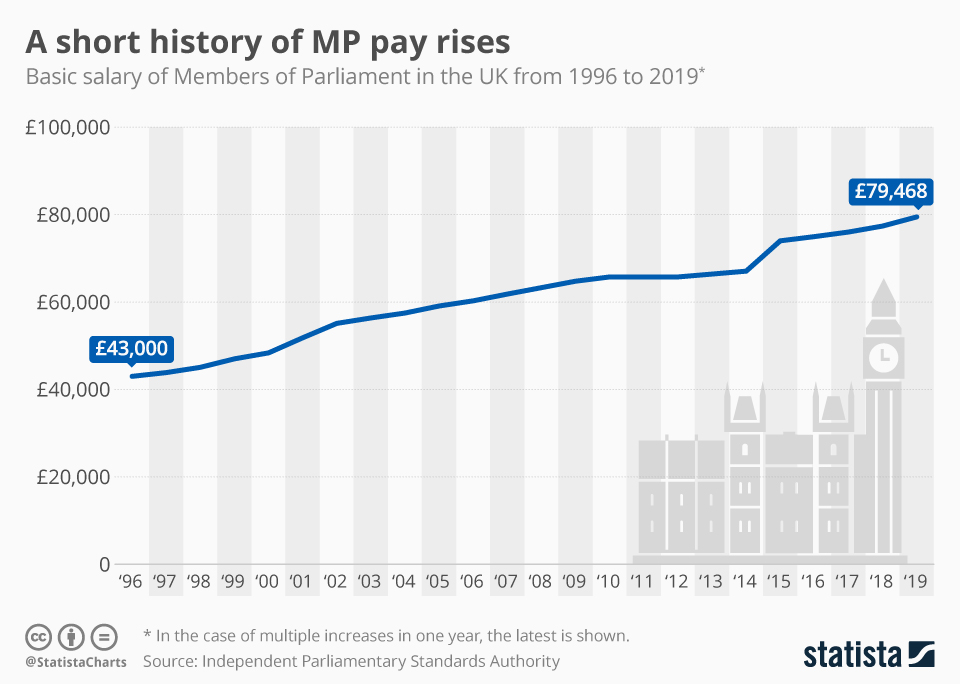
As the "Brexit Shambles" rumbles on, MPs in the UK received their annual pay rise today - a 2.7 percent increase to a basic salary of £79,468. This infographic takes a look back at the recent history of MP pay, showing a significant difference between today's figure and the £43,000 of 1996. Since the Independent Parliamentary Standards Authority took control of MPs' pay in 2010, salaries are linked directly to average changes in the public sector. This year's rise is above inflation.
UK Politics
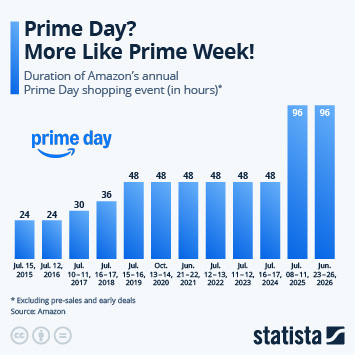
A short history of MP pay rises

Description
This chart shows the basic salary of Members of Parliament in the UK from 1996 to 2019.