Skip to main content
Consumer Goods & FMCG
E-Commerce
Economy & Politics
Energy & Environment
Health, Pharma & Medtech
Internet
Media
Technology & Telecommunications
Transportation & Logistics
Travel, Tourism & Hospitality
View all industries
Global data volume growth
Global AI market size
Number of generative AI users worldwide
Global inflation rate
Retail e-commerce sales worldwide
Largest economies worldwide
Biggest social media platforms by users
Global EV market share by manufacturer
International tourist arrivals by world region
Global annual CO₂ emissions
Browse recent statistics
Artificial intelligence (AI) worldwide
TikTok
Nvidia
E-commerce worldwide
Global GDP
Instagram
Apparel market worldwide
Video gaming worldwide
Global renewable energy industry
Influencer marketing worldwide
Browse recent topics
Consumer Trends 2026
Artificial Intelligence: in-depth market analysis
E-commerce challenges
Global economy
TikTok
Luxury goods: in-depth market analysis
Electric vehicles: A global overview
Video gaming worldwide
Travel and tourism trends 2026
Battery recycling worldwide
Browse recent reports
Explore the tool
Explore Classic mode
Advertising & Media
eCommerce
Consumer
Finance
Global Indicators
Health
Industrial
Mobility
Technology
Explore Market Insights
eCommerce Insights
Research AI
Book a demo
All integrations
Developer docs
Explore Statista Connect
Research
Strategy & Consulting
Marketing
Media & PR
Explore AI assistants
Marketing
Research & Development
Strategy
Sales
Find the fact
Tell the story
Win the pitch
Understand the market
Develop your strategy
Academia
Agencies
Consultancies
Consumer goods
Finance
Tech
Research solutions
Strategy consulting
Communication services
Explore Statista+
Statista R
Statista Healthcare
About Statista
First steps & help center
Webinar & training hub
Success stories
Individuals & Small Teams
Businesses & Enterprises
Academia & Government
English
Deutsch
Daily Data
Infographics on the topic "uk"
Packaged Food
Aug 26, 2019
This chart shows the countries where packaged food an drink was unhealthiest between 2013 and 2018.
More Information
Cricket
Aug 26, 2019
This chart shows the lowest scoring innings for England at the Ashes.
More Information
Crime
Aug 23, 2019
More Information
Retail
Aug 23, 2019
This chart shows the UK brands with the highest and lowest 'customer service scores' in 2019.
More Information
Brexit
Aug 22, 2019
This chart shows the inflow of EU adults to the UK for work-related reasons (millions).
More Information
Cybersecurity
Aug 21, 2019
This chart shows consumers concerned about data misuse and taking taking active measures to protect their data.
More Information
UK
Aug 21, 2019
This chart shows the estimated number of children classified as 'homeless' in England in 2016/17.
More Information
World of Work
Aug 20, 2019
This chart shows the share of employees that find certain office jargon phrases annoying.
More Information
World of Work
Aug 20, 2019
This chart shows the most hated email jargon, according to a survey by Adobe.
More Information
Retail
Aug 20, 2019
This chart shows the share of UK grocery market spend in the 12 weeks to 10 August 2019, by retailer.
More Information
2019 Fragile States Index
Aug 20, 2019
This chart shows the results of the 2019 Fragile States Index (120 = highest fragility).
More Information
Brexit
Aug 20, 2019
This chart shows ten most numerous groups of EU citizens in the United Kingdom by nationality 2018.
More Information
Children
Aug 14, 2019
This chart shows the share of children in the UK unable to identify the following in 2019.
More Information
Internet
Aug 13, 2019
This chart shows the share of households in Great Britain with internet access from 1998 to 2019.
More Information
Airbnb
Aug 12, 2019
This chart shows the number of active listings in the UK on Airbnb and HomeAway/Vrbo in June 2019, by location.
More Information
Football/Soccer
Aug 12, 2019
This chart shows Premier League teams ranked by the estimated transfer value of their most valuable player.
More Information
NHS
Aug 12, 2019
This chart shows the average waiting time for a non-urgent GP appointment in England from 2016 to 2019.
More Information
Sport
Aug 8, 2019
This chart shows the number and share of Premier League teams with a shirt sponsor from the gambling industry.
More Information
Gun Violence
Aug 6, 2019
This chart shows estimated video game industry revenue versus gun deaths per capita.
More Information
UK Politics
Aug 2, 2019
This chart shows the share of votes received in 2019 Brecon and Radnorshire by-election, by party.
More Information
Paywalls
Aug 1, 2019
This chart shows the percent breakdown of pay models across media types for select countries.
More Information
Third-Level Education
Aug 1, 2019
This chart shows annual tuition fees for domestic students in 2019 (excluding admin fees).
More Information
India
Jul 30, 2019
This chart shows the number of wild tigers documented in India.
More Information
United Kingdom
Jul 30, 2019
This chart shows the maths and English GCSE attainment gap between children from poor and wealthier families.
More Information
UK Politics
Jul 29, 2019
This chart compares Voting intention in the United Kingdom in two July 2019 polls.
More Information
Heatwave
Jul 24, 2019
This chart shows the maximum temperature forecast for selected cities for 25 July 2019.
More Information
United Kingdom
Jul 24, 2019
This chart shows responses to: "which of the following best reflects your reaction to Boris Johnson becoming leader?"
More Information
Climate Change Litigation
Jul 22, 2019
This chart shows the quantity of legal climate cases between May 2018 and May 2019.
More Information
Brexit
Jul 22, 2019
This chart shows the share who think it's likely/unlikely the UK will leave the EU by Oct 31st, 2019.
More Information
Drug Deaths
Jul 16, 2019
This chart show the number of drug-related deaths in Scotland from 1996 to 2018.
More Information
Cricket World Cup
Jul 15, 2019
This chart shows Cricket World Cup wins from 1975 to 2019.
More Information
Child Support
Jul 10, 2019
This chart shows the share of parents who support their adult children financially on a regular basis in selected locations.
More Information
Conservative Party
Jul 10, 2019
This chart shows Conservative voting intention and views of Boris Johnson's private life.
More Information
Ethnicity Pay Gap
Jul 9, 2019
This chart shows the difference in hourly pay between white employees and ethnic minorities in 2019.
More Information
UK Retail Sales
Jul 9, 2019
This chart shows the forecast share of total retail spending that's online in the UK.
More Information
Equal Pay for Athletes
Jul 8, 2019
This chart shows what Americans think about equal pay for female and male athletes.
More Information
Climate Change
Jul 5, 2019
This chart shows the estimated impact of a 4C temperature increase on real GDP in 2048.
More Information
UK Politics
Jul 4, 2019
This chart shows the net favourability of political parties in the UK from 2017 to 2019.
More Information
North Korea
Jul 4, 2019
This chart shows the countries believed to currently host or that have recently hosted North Korean migrant workers (2018).
More Information
Transportation
Jul 4, 2019
This chart shows the car models with the most new registrations in the UK in 2019.
More Information
Amazon
Jul 2, 2019
This chart shows the number of Amazon distribution locations worldwide in 2019.
More Information
Women in STEM
Jun 27, 2019
This chart shows the difference between genders in perceived knowledge of science.
More Information
Demographics
Jun 26, 2019
This chart shows year on year change of the UK population from 1953 to 2018.
More Information
Survey
Jun 26, 2019
Share of UK parents saying they have experienced certain damge to the home caused by their toddler(s) in 2019.
More Information
Royal Family
Jun 25, 2019
This chart shows the most expensive journeys conducted by members of the royal family (2018-2019).
More Information
United Kingdom
Jun 25, 2019
This chart shows the share of people in the UK in top professions/jobs that attended an independent school in 2019.
More Information
Media Consumption
Jun 20, 2019
This chart shows the percentage of people in different countries who said they were checking the news more than once a day.
More Information
Global Politics
Jun 20, 2019
This chart shows the share of people saying selected countries mostly use their influence for bad around the world in 2019.
More Information
Plastic Waste
Jun 20, 2019
This chart shows trade flows of the largest exporters of plastic waste in the world.
More Information
Health
Jun 20, 2019
This chart shows the most commonly cited reasons for teens in Great Britain for trying an e-cigarette in 2019.
More Information
New Ranking
Jun 20, 2019
This chart shows the CEOs with the largest share of UK employees that approve of their performance in 2019.
More Information
Vaccines
Jun 19, 2019
This chart shows the countries where most people are skeptical of vaccines (neither agree nor disagree that vaccines are safe).
More Information
Science
Jun 19, 2019
This chart compares attitudes towards vaccinations in France and the UK.
More Information
Global threats
Jun 19, 2019
This graphic shows the most commonly cited major threat by respondents for 26 countries.
More Information
Health
Jun 19, 2019
This chart shows the share strongly or somewhat disagreeing that vaccines are safe in 2019.
More Information
Brexit
Jun 19, 2019
This chart shows the share of Conservatives who would accept the following for Brexit to take place
More Information
Selfie Usage
Jun 18, 2019
This chart shows the percent of U.S. adults who agree with Disney's ban on selfie sticks.
More Information
Racism in Football
Jun 18, 2019
Football supporter arrests where racism was an aggravating factor in the UK.
More Information
UK Politics
Jun 18, 2019
This chart shows the share of Conservative Party members saying leadrship candidates would make a good leader.
More Information
Political Polarization
Jun 14, 2019
This chart shows the share of respondents that trust most news most of the time by partisanship.
More Information
Quality of Life
Jun 14, 2019
This chart shows the average rank for indicators of family-friendly policies of selected European countries.
More Information
UK politics
Jun 13, 2019
This chart shows the number of Conservative MPs backing leadership candidates in the first round ballot.
More Information
Fake News
Jun 13, 2019
This chart shows the share concerned about what is real and fake on the internet when it comes to news in 2019.
More Information
Alcohol
Jun 11, 2019
This chart compares key figures for the brewing company Brewdog PLC in 2010 and 2018.
More Information
Manufacturing
Jun 7, 2019
This chart shows the number of engines manufactured in the UK in 2018 and 2019.
More Information
Systems of Measurement
Jun 6, 2019
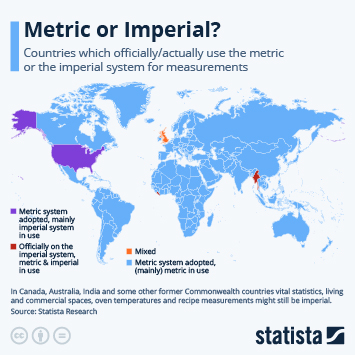
This chart shows countries which officially/actually use the metric or the imperial system for measurements.
More Information
75th Anniversary of D-Day
Jun 5, 2019
This chart shows some of the key numbers behind the Normandy invasion.
More Information
Economy
Jun 4, 2019
This infographic presents the categories with the largest year-on-year growth in consumer spending in the UK.
More Information
Health
Jun 4, 2019
This chart shows new sexually transmitted infection diagnosis rates in England in 2018.
More Information
Trump UK Visit
Jun 4, 2019
This chart shows the approval ratings of U.S. politicians in the UK.
More Information
Royal Air Force
Jun 4, 2019
This chart shows the estimated number of ISIS fighters killed by the Royal Air Force (Sept 2014-Jan 2019).
More Information
Brexit
Jun 3, 2019
This chart shows the number of Irish passport applications from Great Britain by year.
More Information
Health
May 31, 2019
This infographic looks at GP surgery closures in the UK from 2013 to 2018.
More Information
Retail
May 29, 2019
This chart shows the high street shops in the UK with the best customer satisfaction in 2019.
More Information
Retail
May 29, 2019
This chart shows the high street shops in the UK with the lowest customer satisfaction in 2019.
More Information
Tech
May 28, 2019
This chart presents the share of adults in the EU that have used the internet within the last three months.
More Information
Tourism
May 28, 2019
This chart shows the countries from which the most residents were visitors to the UK in 2018.
More Information
Demography
May 28, 2019
This chart shows the estimated number of foreign-born UK residents in 2018, by origin area.
More Information
Mobile internet
May 27, 2019
This chart shows the saverage 4G download speeds experienced on UK networks in 2019.
More Information
Streaming
May 27, 2019
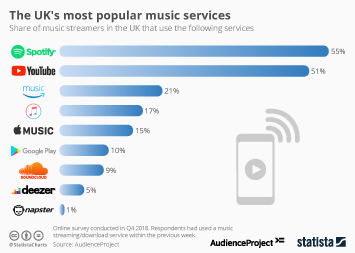
This chart shows the most popular music streaming/download services in the UK in 2018.
More Information
Politics
May 27, 2019
This chart shows the voter turnout in the UK for the European Parliamentary elections from 1979 to 2019.
More Information
European Elections
May 27, 2019
This chart shows turnout by country at the 2019 European Elections.
More Information
European Elections
May 27, 2019
This chart shows the change in seat distribution among political groups in the 2019 European Elections.
More Information
Politics
May 27, 2019
This chart shows the share of UK votes received in the 2019 European Parliamentary elections, by party.
More Information
Premier League
May 24, 2019
This chart shows the Premier League's payments to clubs in the 2018/19 season.
More Information
EU budget
May 24, 2019
This chart shows member state contributions to the 2018 EU budget in percent.
More Information
UK Politics
May 23, 2019
This infographic shows the favourites among Conservative Party members for the soon vacant leadership role.
More Information
Brexit
May 22, 2019
This chart shows voting intention in the UK for the 2019 European Parliamentary elections.
More Information
Public Transport
May 22, 2019
This chart shows the average cost of a monthly ticket for public transportation in 2019.
More Information
Health
May 21, 2019
This chart reveals the number of cosmetic surgery procedures carried out in the UK in 2018, by gender.
More Information
13
/
25
Contact
Get in touch with us. We are happy to help.
Do you still have questions?
Feel free to contact us anytime using our
contact form
or visit our
FAQ page
.
Your contact to the Infographics Newsroom
Felix Richter
Data Journalist
felix.richter@statista.com
+49 (40) 284 841 557