programmatic display ad spend stood at 63 billion U.S. dollars that year, the shares stood at 18 and 51 percent, respectively.
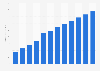
During a 2020 survey, 16 percent of responding Latin American brands stated they had completely moved programmatic buying in house; 48 percent said they had partially done so. In the United States, where Share of brands which moved programmatic buying in-house in selected regions worldwide in 2020
Basic Account
Get to know the platform
You only have access to basic statistics.
This statistic is not included in your account.
Starter Account
The ideal entry-level account for individual users
- Instant access to 1m statistics
- Download in XLS, PDF & PNG format
- Detailed references
$199 USD / Month *
Professional Account
Full access
Business Solutions including all features.
* Prices do not include sales tax.
Other statistics that may interest you Statistics on
About the industry
10
- Premium Statistic Objectives of in-house programmatic advertising campaigns worldwide 2020
- Premium Statistic Objectives of in-house programmatic advertising campaigns in the U.S. 2020
- Premium Statistic Methods of executing in-house programmatic buying worldwide 2020, by region
- Premium Statistic Programmatic buying functions being outsourced worldwide 2020
- Premium Statistic Programmatic buying functions being outsourced in the U.S. 2020
- Premium Statistic Programmatic advertising spending in Peru 2021-2023
- Premium Statistic Programmatic ad spend in the U.S. 2013-2023, by device
- Premium Statistic Share of programmatic in display ad spend in the U.S. 2018-2024
- Premium Statistic Leading wrappers in the U.S. 2020
- Premium Statistic Wrapper set-up types used in the U.S. 2020
About the region
10
- Premium Statistic Most used automation product suppliers within Global 2000 enterprises 2020
- Premium Statistic Most used SSPs worldwide 2020
- Premium Statistic Companies outsourcing with active ITO and BPO contracts worldwide 2010-2019
- Premium Statistic Outsourcing expenditure worldwide by region 2010-2019
- Premium Statistic Plans concerning outsourcing / managed services by industry sector 2019
- Premium Statistic Investment plans in outsourcing by industry sector 2019
- Premium Statistic Global cost component of BPO by type 2017
- Premium Statistic Projected size of the digital manufacturing market 2030
- Premium Statistic Global warehouse automation market size 2023-2027
- Premium Statistic Number of users of smart homes worldwide 2019-2028
Other regions
10
- Premium Statistic Programmatic ad spend in the Netherlands 2017-2021
- Premium Statistic Ad technologies experimented with in Russia 2020
- Premium Statistic Outsourcing penetration rate in Europe by country 2019
- Premium Statistic Outsourcing penetration rate in the Middle East by country 2019
- Premium Statistic Outsourcing penetration rate in Asia Pacific by country 2019
- Premium Statistic Outsourcing expenditure in North America by country 2019
- Premium Statistic Outsourcing expenditure Latin America by country 2019
- Premium Statistic Share of transportation companies using robots in Italy 2018, by firm size
- Premium Statistic Benefits of wrappers in the U.S. 2020
- Premium Statistic Atento S.A. revenue in Guatemala 2016-2021
Related statistics
10
- Premium Statistic Mobile share of programmatic video ad spend in the U.S. 2019-2022
- Premium Statistic Ad fraud rates worldwide 2022, by browser
- Premium Statistic Ad fraud rates 2021, by country
- Premium Statistic Header bidding adoption in the U.S. 2020-2022
- Premium Statistic Leading header-bidding technologies in the U.S. 2022
- Premium Statistic Leading header-bidding technologies worldwide 2023
- Premium Statistic Header bidding adoption worldwide 2021-2023, by website traffic
- Premium Statistic Programmatic ad spend in the Nordics 2021
- Premium Statistic Largest programmatic markets worldwide 2021
- Premium Statistic Number of DSPs used by buyers in Europe 2016-2021
Further Content: You might find this interesting as well
Statistics
Statista. (August 4, 2020). Share of brands which moved programmatic buying in-house in selected regions worldwide in 2020 [Graph]. In Statista. Retrieved March 19, 2024, from https://www.statista.com/statistics/1203740/insourcing-programmatic-buying/
Statista. "Share of brands which moved programmatic buying in-house in selected regions worldwide in 2020." Chart. August 4, 2020. Statista. Accessed March 19, 2024. https://www.statista.com/statistics/1203740/insourcing-programmatic-buying/
Statista. (2020). Share of brands which moved programmatic buying in-house in selected regions worldwide in 2020. Statista. Statista Inc.. Accessed: March 19, 2024. https://www.statista.com/statistics/1203740/insourcing-programmatic-buying/
Statista. "Share of Brands Which Moved Programmatic Buying In-house in Selected Regions Worldwide in 2020." Statista, Statista Inc., 4 Aug 2020, https://www.statista.com/statistics/1203740/insourcing-programmatic-buying/
Statista, Share of brands which moved programmatic buying in-house in selected regions worldwide in 2020 Statista, https://www.statista.com/statistics/1203740/insourcing-programmatic-buying/ (last visited March 19, 2024)
Share of brands which moved programmatic buying in-house in selected regions worldwide in 2020 [Graph], Statista, August 4, 2020. [Online]. Available: https://www.statista.com/statistics/1203740/insourcing-programmatic-buying/