In 2009, Alibaba Group created the connection between Singles Day and online shopping as the company tried to generate sales for its Tmall unit by offering special pricing and promotions within a 24 hour period. Today, Singles Day online sales surpass U.S. Cyber Monday sales by a wide margin with online shoppers placing more than 2.3 billion orders on Alibaba’s Tmall and Taobao e-commerce properties during the Singles Day sales.
A challenge for couriers
China’s e-commerce giant Alibaba announced its GMV on Singles’ Day hit 74.1 billion U.S. dollars in 2020. The one-day shopping craze resulted in a tremendous amount of packages waiting to be delivered. Owning to the express delivery companies’ efficiency, consumers in China have become accustomed to short delivery times. According to China’s State Post Bureau, around 2.8 billion packages were distributed and delivered in the week following Singles’ Day in 2019.
Red envelopes on Singles’ Day
For most young Chinese, red envelopes not only represent gifts of lucky money on Chinese New Year, but also a way to secure the best deal at the Singles’ Day sales. To improve consumer engagement, Alibaba developed an elaborate sales scheme for its Singles’ Day sale, such as pre-sale deals and coupons. Consumers could also play various games to receive coupons (or red envelopes) for extra discounts on Singles’ Day.
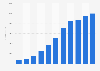
Number of online orders generated on Alibaba e-commerce properties on Singles Day from 2013 to 2020
(in billions)
Profit from the additional features of your individual account
Currently, you are using a shared account. To use individual functions (e.g., mark statistics as favourites, set
statistic alerts) please log in with your personal account.
If you are an admin, please authenticate by logging in again.
Learn more about how Statista can support your business.
Alibaba. (November 12, 2020). Number of online orders generated on Alibaba e-commerce properties on Singles Day from 2013 to 2020 (in billions) [Graph]. In Statista. Retrieved September 19, 2024, from https://www.statista.com/statistics/364780/number-of-orders-alibaba-singles-day/
Alibaba. "Number of online orders generated on Alibaba e-commerce properties on Singles Day from 2013 to 2020 (in billions)." Chart. November 12, 2020. Statista. Accessed September 19, 2024. https://www.statista.com/statistics/364780/number-of-orders-alibaba-singles-day/
Alibaba. (2020). Number of online orders generated on Alibaba e-commerce properties on Singles Day from 2013 to 2020 (in billions). Statista. Statista Inc.. Accessed: September 19, 2024. https://www.statista.com/statistics/364780/number-of-orders-alibaba-singles-day/
Alibaba. "Number of Online Orders Generated on Alibaba E-commerce Properties on Singles Day from 2013 to 2020 (in Billions)." Statista, Statista Inc., 12 Nov 2020, https://www.statista.com/statistics/364780/number-of-orders-alibaba-singles-day/
Alibaba, Number of online orders generated on Alibaba e-commerce properties on Singles Day from 2013 to 2020 (in billions) Statista, https://www.statista.com/statistics/364780/number-of-orders-alibaba-singles-day/ (last visited September 19, 2024)
Number of online orders generated on Alibaba e-commerce properties on Singles Day from 2013 to 2020 (in billions) [Graph], Alibaba, November 12, 2020. [Online]. Available: https://www.statista.com/statistics/364780/number-of-orders-alibaba-singles-day/