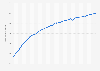
Mobile social media and communication apps accounted for the bulk of global hours spend on mobile apps. In 2022, social and communication apps accounted for approximately 42 percent of the time users worldwide spent on mobile apps. Photo and video apps accounted for 25 percent of mobile hours, up from 24.2 percent in 2020. Time spent on gaming apps fluctuated between 2020 and 2022, with global users spending approximately eight percent of their mobile time gaming in 2022.
Distribution of global time spent on mobile in 2020 to 2022, by category
Profit from the additional features of your individual account
Currently, you are using a shared account. To use individual functions (e.g., mark statistics as favourites, set
statistic alerts) please log in with your personal account.
If you are an admin, please authenticate by logging in again.
Learn more about how Statista can support your business.
Data.ai. (January 3, 2023). Distribution of global time spent on mobile in 2020 to 2022, by category [Graph]. In Statista. Retrieved July 27, 2024, from https://www.statista.com/statistics/435324/share-app-time-category/
Data.ai. "Distribution of global time spent on mobile in 2020 to 2022, by category." Chart. January 3, 2023. Statista. Accessed July 27, 2024. https://www.statista.com/statistics/435324/share-app-time-category/
Data.ai. (2023). Distribution of global time spent on mobile in 2020 to 2022, by category. Statista. Statista Inc.. Accessed: July 27, 2024. https://www.statista.com/statistics/435324/share-app-time-category/
Data.ai. "Distribution of Global Time Spent on Mobile in 2020 to 2022, by Category." Statista, Statista Inc., 3 Jan 2023, https://www.statista.com/statistics/435324/share-app-time-category/
Data.ai, Distribution of global time spent on mobile in 2020 to 2022, by category Statista, https://www.statista.com/statistics/435324/share-app-time-category/ (last visited July 27, 2024)
Distribution of global time spent on mobile in 2020 to 2022, by category [Graph], Data.ai, January 3, 2023. [Online]. Available: https://www.statista.com/statistics/435324/share-app-time-category/