Skip to main content
Consumer Goods & FMCG
E-Commerce
Economy & Politics
Energy & Environment
Health, Pharma & Medtech
Internet
Media
Technology & Telecommunications
Transportation & Logistics
Travel, Tourism & Hospitality
View all industries
Global data volume growth
Global AI market size
Number of generative AI users worldwide
Global inflation rate
Retail e-commerce sales worldwide
Largest economies worldwide
Biggest social media platforms by users
Global EV market share by manufacturer
International tourist arrivals by world region
Global annual CO₂ emissions
Browse recent statistics
Artificial intelligence (AI) worldwide
TikTok
Nvidia
E-commerce worldwide
Global GDP
Instagram
Apparel market worldwide
Video gaming worldwide
Global renewable energy industry
Influencer marketing worldwide
Browse recent topics
Consumer Trends 2026
Artificial Intelligence: in-depth market analysis
E-commerce challenges
Global economy
TikTok
Luxury goods: in-depth market analysis
Electric vehicles: A global overview
Video gaming worldwide
Travel and tourism trends 2026
Battery recycling worldwide
Browse recent reports
Explore the tool
Explore Classic mode
Advertising & Media
eCommerce
Consumer
Finance
Global Indicators
Health
Industrial
Mobility
Technology
Explore Market Insights
eCommerce Insights
Research AI
Book a demo
All integrations
Developer docs
Explore Statista Connect
Research
Strategy & Consulting
Marketing
Media & PR
Explore AI assistants
Marketing
Research & Development
Strategy
Sales
Find the fact
Tell the story
Win the pitch
Understand the market
Develop your strategy
Academia
Agencies
Consultancies
Consumer goods
Finance
Tech
Research solutions
Strategy consulting
Communication services
Explore Statista+
Statista R
Statista Healthcare
About Statista
First steps & help center
Webinar & training hub
Success stories
Individuals & Small Teams
Businesses & Enterprises
Academia & Government
English
Deutsch
Daily Data
Infographics on the topic " rel="
U.S. Military
Sep 13, 2019
This chart shows the number of U.S. service personnel deployed in Afghanistan between 2011 and 2019.
More Information
Recession
Sep 13, 2019
This chart shows the states with the most recession quarters since 2010.
More Information
2020
Sep 13, 2019
Minutes spoken in the September 12 televised Democratic debate
More Information
Rugby World Cup
Sep 13, 2019
This chart shows international Rugby World Cup ticket sales by nationality.
More Information
2020
Sep 13, 2019
This chart shows the number of times candidates mentioned Donald Trump in the Sep 12 Democratic debate.
More Information
Afghanistan
Sep 13, 2019
This chart shows the cost of the Afghanistan conflict from 2001 to 2017.
More Information
AI Use in Retail
Sep 12, 2019
This chart shows the AI use case distribution in retail organizations worldwide in 2018, by operating model.
More Information
Consumer Behavior
Sep 12, 2019
This chart shows actions taken by digital buyers when using a retailer's mobile app while in-store.
More Information
Oil Exports
Sep 12, 2019
This chart shows crude oil exports in the top exporting countries as of June 2019 (Canada, United States, Iraq, Saudi Arabia, Russia).
More Information
Electricity Consumption
Sep 12, 2019
This chart shows electricity consumption per capita in 2016 (megawatt hours).
More Information
Coworking spaces
Sep 12, 2019
This chart shows the of coworking spaces as share of total office take-up in selected cities in Europe in 2018.
More Information
Northern Ireland
Sep 12, 2019
This chart shows responses to "if there was a referendum tomorrow, how would you vote?"
More Information
Suicide Prevention Week
Sep 11, 2019
This chart show suicide deaths by cause in the U.S. in 2017.
More Information
Suicide Prevention Week
Sep 11, 2019
This chart shows the firearm deaths by category in the United States in 2017.
More Information
Tech
Sep 11, 2019
This chart shows the contribution of the mobile industry to global GDP in 2018, by region.
More Information
Brexit
Sep 10, 2019
This chart shows responses to a survey question on how the UK prime minister should approach requesting an Article 50 extension.
More Information
iPhone
Sep 10, 2019
This chart shows smartphone models by 4G download speed experienced in the U.S. in 2019 (Mbps).
More Information
iPhone
Sep 10, 2019
This chart shows average 4G download speeds experienced by iPhone models in the U.S. (Mbps)
More Information
Education
Sep 10, 2019
This chart shows the estimated UHNW alumni population and collective wealth in 2019 (billion U.S. dollars).
More Information
Clean Air
Sep 9, 2019
This chart shows the countries ranked by presence of indoor and outdoor air pollution.
More Information
Data Privacy
Sep 9, 2019
This is the cost of recent settlement as a percent of Google's revenue (in million USD).
More Information
Android OS
Sep 9, 2019
This chart shows the mobile Android operating system market share by version in the United States between 2017 and 2019.
More Information
Patreon
Sep 9, 2019
This chart shows the top creators on Patreon by number of patrons in September 2019.
More Information
News Apps
Sep 9, 2019
This chart shows the percent of phones select apps were found on.
More Information
eSports
Sep 9, 2019
This chart shows the career winnings of the best-earning eSport players.
More Information
Brexit
Sep 9, 2019
This chart shows the number of times MPs have changed party since 1945.
More Information
Digital Security
Sep 9, 2019
This chart shows the top-10 digital security scorers in the 2019 Safe Cities Index (100=best).
More Information
Cannabis
Sep 9, 2019
This chart shows the total level of cannabis consumption in 2018 (metric tons).
More Information
Brexit
Sep 9, 2019
This chart shows voting intention in the event of two Brexit-related scenarios in September 2019.
More Information
Corruption
Sep 6, 2019
Thic chart shows the most notorious embezzlers among state leaders.
More Information
Sep 6, 2019
This chart shows the most surveilled cities in Europe (2019).
More Information
United Kingdom
Sep 6, 2019
This flow chart covers potential Brexit scenarios and likely outcomes as of September 2019.
More Information
Facebook
Sep 6, 2019
This chart shows a ranking of social media platforms according to the impact on youth mental health.
More Information
Cloud Backup
Sep 5, 2019
This chart shows the average rating for select backup solution features for businesses worldwide in 2019.
More Information
Poll
Sep 5, 2019
This chart shows survey responses concerning Donald Trump and fears of an upcoming recession (2019).
More Information
Soft Power
Sep 5, 2019
This chart shows the countries in which the most current world leaders received higher education as of 2019.
More Information
Travel Tech
Sep 4, 2019
This chart shows the select pain points with booking travel online or via apps.
More Information
Travel Tech
Sep 4, 2019
This chart shows the share of respondents who feel the following benefit them when booking online/via apps.
More Information
Chinese GDP
Sep 4, 2019
This chart shows the contributions of different regions and cities to Chinese GDP (2017).
More Information
Entrepreneurs
Sep 4, 2019
This chart shows the share of South Korean population engaged in entrepreneurial activity, by gender.
More Information
Sponsored Post
Sep 3, 2019
The infographic is about venture capital flowing into Berlin startups.
More Information
Imprisonment Rates
Sep 2, 2019
This chart shows the countries imprisoning the most people as a share of their population.
More Information
Vegan Fast Food
Sep 2, 2019
This chart shows nutritional information of Burger King and KFC meatless menu items.
More Information
Labor Unions
Aug 30, 2019
This chart shows the percent approving of labor unions by party in the United States.
More Information
Market Capitalization
Aug 30, 2019
This chart shows the value of market capitalization for the Global Top 100 companies by region, in billion USD.
More Information
NFL
Aug 29, 2019
Thic chart lists the professions of former NFL players (2017).
More Information
Xiaomi
Aug 29, 2019
This chart shows Xiaomi's worldwide revenue and smartphone market share from 2015 to the first two quarters of 2019.
More Information
United Kingdom
Aug 29, 2019
This chart shows House of Commons sitting days by session since 1945.
More Information
Paywalls
Aug 28, 2019
This chart shows the share of online publishers by number of free articles in front of their paywall per month.
More Information
Beach Litter
Aug 27, 2019
This chart shows the top ten litter items collected on European beaches between 2013 and 2019.
More Information
Meat Alternatives
Aug 26, 2019
This chart shows the percent of consumers who are willing to alter meat intake for environmental reasons.
More Information
Cloud Vendors
Aug 26, 2019
This chart shows the share of industry professionals planning to use or using cloud platform services by vendor.
More Information
Packaged Food
Aug 26, 2019
This chart shows the countries where packaged food an drink was unhealthiest between 2013 and 2018.
More Information
Brazil
Aug 26, 2019
This chart shows the number of wildfires recorded in Brazil by year.
More Information
PMI
Aug 23, 2019
This chart shows the IHS Markit U.S. Flash PMI (Purchasing Managers Index).
More Information
Online Grocery Shopping
Aug 23, 2019
This chart shows the share of Americans and their families who do the following.
More Information
Google
Aug 22, 2019
This chart shows Google's advertisting revenue compared to total ad spend in the largest ad markets in 2018.
More Information
Brexit
Aug 22, 2019
This chart shows the inflow of EU adults to the UK for work-related reasons (millions).
More Information
Student Debt
Aug 21, 2019
This chart shows the proportion of 2018 graduates with student loan debt by state.
More Information
Spain
Aug 21, 2019
This chart shows the number of robberies involving violence and/or intimidation in the first half of the year.
More Information
Cybersecurity
Aug 21, 2019
This chart shows consumers concerned about data misuse and taking taking active measures to protect their data.
More Information
Commuting
Aug 21, 2019
Thi chart shows how the average length of the Australian commute has changed since 2002.
More Information
Geography
Aug 21, 2019
This chart shows the total area of the world's largest islands.
More Information
World of Work
Aug 20, 2019
This chart shows the most hated email jargon, according to a survey by Adobe.
More Information
Retail
Aug 20, 2019
This chart shows the share of UK grocery market spend in the 12 weeks to 10 August 2019, by retailer.
More Information
2019 Fragile States Index
Aug 20, 2019
This chart shows the results of the 2019 Fragile States Index (120 = highest fragility).
More Information
Brexit
Aug 20, 2019
This chart shows ten most numerous groups of EU citizens in the United Kingdom by nationality 2018.
More Information
Hurling
Aug 20, 2019
This chart shows All-Ireland Senior Hurling Championship wins by county.
More Information
Vacation
Aug 19, 2019
This chart shows the total number of unused vacation days & number permanently forfeited in the U.S.
More Information
China/U.S. Trade
Aug 19, 2019
This chart shows the U.S. trade balance with China from 2014 to June 2019 (in billion U.S. dollars).
More Information
U.S. Job Market
Aug 19, 2019
This chart shows seasonally-adjusted non-farm job creation in the U.S. from 2008 to 2019.
More Information
Travel
Aug 19, 2019
This chart shows the average and peak waiting time at TSA security screening in 2019 (in minutes).
More Information
Media Time
Aug 16, 2019
The daily time spent with media per capita worldwide from 2011 to 2021, by medium (in minutes).
More Information
Travel Industry
Aug 16, 2019
This chart shows the percent of U.S. respondents who think each device is the most important for the following travel-related activities.
More Information
CEO Pay
Aug 16, 2019
This chart shows average annual U.S. CEO and private-sector worker compensation.
More Information
Cloud Computing Market
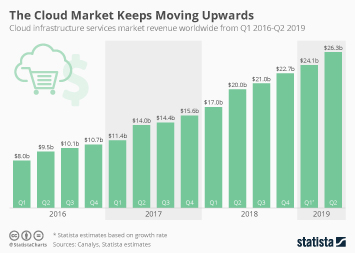
Aug 15, 2019
This chart shows the cloud infrastructure services market worldwide from Q1 2016 to Q2 2019.
More Information
Coworking Space
Aug 15, 2019
This chart shows the number of coworking spaces worldwide between 2005 and 2020.
More Information
Treasury Yield Curve
Aug 15, 2019
This chart shows the U.S. Treasury yield curve as of Aug 5, 2019.
More Information
Aug 14, 2019
This chart shows monthly passenger car shipments in India.
More Information
Infrastructure
Aug 14, 2019
This chart shows Australian transport infrastructure spending from 1986 to 2018.
More Information
Children
Aug 14, 2019
This chart shows the share of children in the UK unable to identify the following in 2019.
More Information
Cathay Pacific Airways
Aug 14, 2019
This chart shows Cathay Pacific Airways Ltd. closing price in U.S. dollars.
More Information
Drug Approvals
Aug 14, 2019
This chart shows the number of foreign and domestic innovative drug approvals in China between 2016 and 2019.
More Information
Trade Tensions
Aug 14, 2019
This chart shows the development of the share of South Korean exports going to Japan and Japanese exports going to South Korea between...
More Information
Electronic Waste
Aug 14, 2019
This chart shows electric and electronic waste generated in 2016 (kg per inhabitant).
More Information
Credit Card Interest Rates
Aug 13, 2019
This chart shows the U.S. commercial bank interest rates on credit card pans between 1995 and 2019.
More Information
Endangered Species
Aug 13, 2019
This chart shows animal species listed as endangered or vulnerable (threatened) is the U.S. in 2005 and 2019.
More Information
Internet
Aug 13, 2019
This chart shows the share of households in Great Britain with internet access from 1998 to 2019.
More Information
Investor Concern
Aug 12, 2019
This chart shows the top concerns between Q2 2018 and Q2 2019.
More Information
Holiday Travel
Aug 12, 2019
This chart shows the estimate number of people traveling during the following events (in the millions).
More Information
5
/
8
Contact
Get in touch with us. We are happy to help.
Do you still have questions?
Feel free to contact us anytime using our
contact form
or visit our
FAQ page
.
Your contact to the Infographics Newsroom
Felix Richter
Data Journalist
felix.richter@statista.com
+49 (40) 284 841 557