Skip to main content
Consumer Goods & FMCG
E-Commerce
Economy & Politics
Energy & Environment
Health, Pharma & Medtech
Internet
Media
Technology & Telecommunications
Transportation & Logistics
Travel, Tourism & Hospitality
View all industries
Global data volume growth
Global AI market size
Number of generative AI users worldwide
Global inflation rate
Retail e-commerce sales worldwide
Largest economies worldwide
Biggest social media platforms by users
Global EV market share by manufacturer
International tourist arrivals by world region
Global annual CO₂ emissions
Browse recent statistics
Artificial intelligence (AI) worldwide
TikTok
Nvidia
E-commerce worldwide
Global GDP
Instagram
Apparel market worldwide
Video gaming worldwide
Global renewable energy industry
Influencer marketing worldwide
Browse recent topics
Consumer Trends 2026
Artificial Intelligence: in-depth market analysis
E-commerce challenges
Global economy
TikTok
Luxury goods: in-depth market analysis
Electric vehicles: A global overview
Video gaming worldwide
Travel and tourism trends 2026
Battery recycling worldwide
Browse recent reports
Explore the tool
Explore Classic mode
Advertising & Media
eCommerce
Consumer
Finance
Global Indicators
Health
Industrial
Mobility
Technology
Explore Market Insights
eCommerce Insights
Research AI
Book a demo
All integrations
Developer docs
Explore Statista Connect
Research
Strategy & Consulting
Marketing
Media & PR
Explore AI assistants
Marketing
Research & Development
Strategy
Sales
Find the fact
Tell the story
Win the pitch
Understand the market
Develop your strategy
Academia
Agencies
Consultancies
Consumer goods
Finance
Tech
Research solutions
Strategy consulting
Communication services
Explore Statista+
Statista R
Statista Healthcare
About Statista
First steps & help center
Webinar & training hub
Success stories
Individuals & Small Teams
Businesses & Enterprises
Academia & Government
English
Deutsch
Daily Data
Infographics on the topic "+"
Media Time
Aug 16, 2019
The daily time spent with media per capita worldwide from 2011 to 2021, by medium (in minutes).
More Information
E-Commerce - Furniture
Aug 16, 2019
This chart shows estimated e-commerce sales of furniture and homewares in 2019.
More Information
Travel Industry
Aug 16, 2019
This chart shows the percent of U.S. respondents who think each device is the most important for the following travel-related activities.
More Information
CEO Pay
Aug 16, 2019
This chart shows average annual U.S. CEO and private-sector worker compensation.
More Information
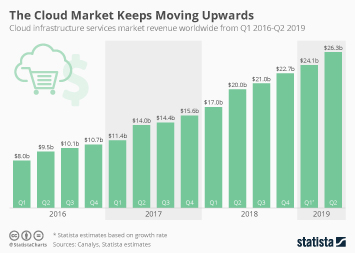
Cloud Computing Market
Aug 15, 2019
This chart shows the cloud infrastructure services market worldwide from Q1 2016 to Q2 2019.
More Information
Coworking Space
Aug 15, 2019
This chart shows the number of coworking spaces worldwide between 2005 and 2020.
More Information
Treasury Yield Curve
Aug 15, 2019
This chart shows the U.S. Treasury yield curve as of Aug 5, 2019.
More Information
Aug 14, 2019
This chart shows monthly passenger car shipments in India.
More Information
Infrastructure
Aug 14, 2019
This chart shows Australian transport infrastructure spending from 1986 to 2018.
More Information
Children
Aug 14, 2019
This chart shows the share of children in the UK unable to identify the following in 2019.
More Information
Cathay Pacific Airways
Aug 14, 2019
This chart shows Cathay Pacific Airways Ltd. closing price in U.S. dollars.
More Information
Drug Approvals
Aug 14, 2019
This chart shows the number of foreign and domestic innovative drug approvals in China between 2016 and 2019.
More Information
Trade Tensions
Aug 14, 2019
This chart shows the development of the share of South Korean exports going to Japan and Japanese exports going to South Korea between...
More Information
Electronic Waste
Aug 14, 2019
This chart shows electric and electronic waste generated in 2016 (kg per inhabitant).
More Information
Credit Card Interest Rates
Aug 13, 2019
This chart shows the U.S. commercial bank interest rates on credit card pans between 1995 and 2019.
More Information
Endangered Species
Aug 13, 2019
This chart shows animal species listed as endangered or vulnerable (threatened) is the U.S. in 2005 and 2019.
More Information
U.S. Dollar
Aug 13, 2019
This chart shows exchange rate indexes of the U.S. dollar opposite other global currencies.
More Information
Internet
Aug 13, 2019
This chart shows the share of households in Great Britain with internet access from 1998 to 2019.
More Information
Investor Concern
Aug 12, 2019
This chart shows the top concerns between Q2 2018 and Q2 2019.
More Information
Holiday Travel
Aug 12, 2019
This chart shows the estimate number of people traveling during the following events (in the millions).
More Information
Airbnb
Aug 12, 2019
This chart shows the number of active listings in the UK on Airbnb and HomeAway/Vrbo in June 2019, by location.
More Information
Football/Soccer
Aug 12, 2019
This chart shows Premier League teams ranked by the estimated transfer value of their most valuable player.
More Information
NHS
Aug 12, 2019
This chart shows the average waiting time for a non-urgent GP appointment in England from 2016 to 2019.
More Information
Trump Rallies
Aug 9, 2019
This chart shows negative terminology used by President Trump during rallies from 2017 to 2019 (as of August) when talking about immigration.
More Information
Football/Soccer
Aug 9, 2019
Summer transfer spending by Premier League clubs from 2004 to 2019.
More Information
Huawei OS
Aug 8, 2019
This chart shows the reasons Chinese internet users are interested/not interested in using a Huawei OS.
More Information
Environment
Aug 8, 2019
This chart shows what U.S. adults have done to reduce the production of/contact with microplastics in 2019.
More Information
Gun Lobby
Aug 8, 2019
This chart shows gun rights and gun control lobby spending in the U.S. between 1998 and 2018.
More Information
Airbnb
Aug 8, 2019
This chart shows the most popular U.S. cities for Airbnb and HomeAway listings in June 2019.
More Information
Brexit
Aug 8, 2019
This chart shows total job losses forecast in EU Member States in the case of a hard-Brexit.
More Information
Sport
Aug 8, 2019
This chart shows the number and share of Premier League teams with a shirt sponsor from the gambling industry.
More Information
Smartphones
Aug 8, 2019
This chart shows the average download speed by handset maker in selected countries (Mbps).
More Information
Hong Kong Protests
Aug 7, 2019
This chart shows the approval ratings of Hong Kong Chief Executives from the start of their terms onwards.
More Information
Residential Property Market
Aug 7, 2019
This chart shows foreign buyer residential property purchases in the U.S. (Apr 2018 to Mar 2019).
More Information
Health
Aug 6, 2019
This chart shows the estimated mean adult salt intake equivalent in selected countries.
More Information
U.S.-China Trade War
Aug 6, 2019
This chart shows the exchange rate of the Chinese Yuan Renminbi to the U.S. dollar in 2018/2019.
More Information
Gun Violence
Aug 6, 2019
This chart shows estimated video game industry revenue versus gun deaths per capita.
More Information
Economy
Aug 6, 2019
This chart shows the countries which the U.S. has desginated as a currency manipulator and those which it is monitoring as of August...
More Information
Avocado Comsumption
Aug 6, 2019
This chart shows U.S. avocado consumption between 1995 and 2018.
More Information
Drought
Aug 6, 2019
This chart shows the share of news stories in Australia that mention both "climate change" and "drought".
More Information
Newspaper Industry
Aug 5, 2019
This chart shows the total paper distribution, by media company in August 2019.
More Information
Solar Energy
Aug 5, 2019
This chart shows the companies with the most installed solar capacity in 2013 vs. 2018 (in megawatts).
More Information
Wifi
Aug 5, 2019
This chart shows the Indian cities where mobile devices are most often connected to Wifi.
More Information
Science
Aug 5, 2019
This chart shows the share who trust the following to act in the best interests of the public.
More Information
U.S. Imports
Aug 5, 2019
This chart shows U.S. imports of goods from its most important import partners in the first half of 2019 vs. 2018.
More Information
International Trade
Aug 5, 2019
This chart shows the U.S. trade balance in goods, services and overall.
More Information
Gun Violence
Aug 5, 2019
This chart shows figures related to gun violence in the U.S. from Jan 2014 to Aug 2019.
More Information
Puerto Rico
Aug 2, 2019
This chart shows the resignation date and title of politicians in 2019.
More Information
Trade Dispute
Aug 2, 2019
This chart tracks U.S. and Chinese action in their on going trade dispute in 2018.
More Information
Digital News
Aug 2, 2019
This chart shows the digital news publications with the highest number of digital-only subscriptions (in millions).
More Information
Beer
Aug 2, 2019
This chart shows beer production by country in 2018 (billion litres)
More Information
UK Politics
Aug 2, 2019
This chart shows the share of votes received in 2019 Brecon and Radnorshire by-election, by party.
More Information
Vaquita
Aug 2, 2019
This chart shows the decline in the vaquita population from 1997 to 2018.
More Information
Hate Crime
Aug 2, 2019
This chart shows the number of hate crimes recorded in 30 U.S. cities.
More Information
Agrifood
Aug 1, 2019
This chart shows the funding for agrifood tech startups (in billions of U.S. dollars).
More Information
Paywalls
Aug 1, 2019
This chart shows the percent breakdown of pay models across media types for select countries.
More Information
2020
Aug 1, 2019
This chart shows the most searched candidates ahead of/during the July 31 Democratic debate, by state.
More Information
Inflation
Aug 1, 2019
This chart shows 2018 consumer price inflation rates in selected countries.
More Information
Dollar Notes in Circulation
Aug 1, 2019
This chart shows the number of U.S. dollar notes in circulation worldwide, by denomination.
More Information
2020
Aug 1, 2019
This chart shows the candidates with the most minutes spoken in the July 31 televised Democratic debate.
More Information
Third-Level Education
Aug 1, 2019
This chart shows annual tuition fees for domestic students in 2019 (excluding admin fees).
More Information
Foreign Exchange Reserves
Aug 1, 2019
This chart shows the currency composition of worldwide foreign exchange reserves
More Information
Artificial Intelligence
Jul 31, 2019
This chart shows the amount of global funding for artificial intelligence startups since 2015.
More Information
Ad Market
Jul 31, 2019
This chart shows the advertising spending in the world's top ad markets in 2018 (in billion U.S. dollars).
More Information
YouTube
Jul 31, 2019
This chart shows the highest-grossing YouTube channels in South Korea as of July 2019.
More Information
Immigration
Jul 31, 2019
This chart shows the contribution of net births and the net immigration rate to population growth in Australia,
More Information
2020
Jul 31, 2019
This chart shows the most searched candidates ahead of/during the July 30 Democratic debate, by state.
More Information
Brexit
Jul 31, 2019
This chart shows the impact of a disorderly Brexit on Irish GDP and employment growth rates.
More Information
2020
Jul 31, 2019
This chart shows the candidates with the most minutes spoken in the July 30 televised Democratic debate.
More Information
European Union
Jul 31, 2019
This chart shows the share of the population who could not afford a one-week holiday away from home in 2018.
More Information
YouTube Content
Jul 30, 2019
This chart shows the median and mean views per videos among popular English-language videos, by content type.
More Information
YouTube
Jul 30, 2019
Percent of all videos posted on popular YouTube channels, by subject.
More Information
Female Workforce
Jul 30, 2019
This chart shows employment rates of men and women in Japan from 2007 to 2019.
More Information
India
Jul 30, 2019
This chart shows the number of wild tigers documented in India.
More Information
Cinema
Jul 30, 2019
This chart shows the domestic box office earnings of Quentin Tarantino's films on the opening weekend.
More Information
United Kingdom
Jul 30, 2019
This chart shows the maths and English GCSE attainment gap between children from poor and wealthier families.
More Information
Clean Energy
Jul 30, 2019
This chart shows U.S. cities with the highest score for clean energy usage and efficiency in July 2019.
More Information
European Union
Jul 29, 2019
This chart shows the number of adopted legislative acts by the European Union annually since 1990*
More Information
Fortnite
Jul 29, 2019
This chart compares the prize money of the winner in the Fortnite World Cup to the prize money in major individual sporting events.
More Information
Sponsored Post
Jul 29, 2019
This infographic shows data about AI startups in Berlin
More Information
UK Politics
Jul 29, 2019
This chart compares Voting intention in the United Kingdom in two July 2019 polls.
More Information
Video Games
Jul 29, 2019
This chart shows the share of players who experienced harassment in selected prominent video games (April 2019).
More Information
Newspaper Industry
Jul 26, 2019
This chart shows the total estimated peak circulation of U.S. newspapers compared to 2018.
More Information
Sex Ed
Jul 26, 2019
This chart shows state laws on sex education in the U.S.
More Information
Germany
Jul 26, 2019
This chart shows the average number of household members in federal states.
More Information
Berlin
Jul 26, 2019
This chart shows the share of the population that are artists by district.
More Information
European Heatwave
Jul 26, 2019
This chart shows the maximum temperatures recorded in selected EU countries (as of 9am on 25 July 2019).
More Information
Tourism
Jul 25, 2019
This chart shows the number of tourists in New York City by country of origin in 2018 (in 1,000).
More Information
Automating Jobs
Jul 25, 2019
This chart shows the jobs at risk of displacement from automation by 2030 (in thousands).
More Information
Facebook's revenue growth
Jul 25, 2019
This chart shows Facebook's revenue growth since the first quarter of 2012.
More Information
92
/
161
Contact
Get in touch with us. We are happy to help.
Do you still have questions?
Feel free to contact us anytime using our
contact form
or visit our
FAQ page
.
Your contact to the Infographics Newsroom
Felix Richter
Data Journalist
felix.richter@statista.com
+49 (40) 284 841 557