Skip to main content
Consumer Goods & FMCG
E-Commerce
Economy & Politics
Energy & Environment
Health, Pharma & Medtech
Internet
Media
Technology & Telecommunications
Transportation & Logistics
Travel, Tourism & Hospitality
View all industries
Global data volume growth
Global AI market size
Number of generative AI users worldwide
Global inflation rate
Retail e-commerce sales worldwide
Largest economies worldwide
Biggest social media platforms by users
Global EV market share by manufacturer
International tourist arrivals by world region
Global annual CO₂ emissions
Browse recent statistics
Artificial intelligence (AI) worldwide
TikTok
Nvidia
E-commerce worldwide
Global GDP
Instagram
Apparel market worldwide
Video gaming worldwide
Global renewable energy industry
Influencer marketing worldwide
Browse recent topics
Consumer Trends 2026
Artificial Intelligence: in-depth market analysis
E-commerce challenges
Global economy
TikTok
Luxury goods: in-depth market analysis
Electric vehicles: A global overview
Video gaming worldwide
Travel and tourism trends 2026
Battery recycling worldwide
Browse recent reports
Explore the tool
Explore Classic mode
Advertising & Media
eCommerce
Consumer
Finance
Global Indicators
Health
Industrial
Mobility
Technology
Explore Market Insights
eCommerce Insights
Research AI
Book a demo
All integrations
Developer docs
Explore Statista Connect
Research
Strategy & Consulting
Marketing
Media & PR
Explore AI assistants
Marketing
Research & Development
Strategy
Sales
Find the fact
Tell the story
Win the pitch
Understand the market
Develop your strategy
Academia
Agencies
Consultancies
Consumer goods
Finance
Tech
Research solutions
Strategy consulting
Communication services
Explore Statista+
Statista R
Statista Healthcare
About Statista
First steps & help center
Webinar & training hub
Success stories
Individuals & Small Teams
Businesses & Enterprises
Academia & Government
English
Deutsch
Daily Data
Global stories vividly visualized
Smartphone Sales
Feb 19, 2019
This chart shows the market share of Chinese manufacturers in smartphone sales in Europe.
More Information
High-Speed Rail
Feb 19, 2019
This chart shows the evolution of the total budget estimation for California's bullet train project.
More Information
Demographics
Feb 19, 2019
This chart shows the average age at which people in the UK have reached certain life milestones.
More Information
Tech
Feb 19, 2019
This chart shows the results of a survey on the most wanted features of a smartphone.
More Information
UEFA Champions League
Feb 19, 2019
This chart compares key facts about Liverpool FC and Bayern Munich.
More Information
Poaching
Feb 19, 2019
This chart shows descriptive statistics regarding elephant poaching.
More Information
Netflix app in Europe
Feb 19, 2019
This chart shows the number of downloads and the in-app purchase net revenue of the Netflix app in 2018 in different European countries.
More Information
Border Wall Lawsuit
Feb 19, 2019
This chart shows the coalition of U.S. states taking legal action as of Feb 19, 2019.
More Information
Amazon
Feb 19, 2019
This chart shows Amazon's U.S. pretax profit and effective tax rate since 2009.
More Information
Manufacturing
Feb 19, 2019
This chart presents key figures related to the presence of Honda in the UK in 2018.
More Information
New Survey
Feb 18, 2019
This chart shows the average expected age at which UK teenagers expect to have achieved certain life milestones.
More Information
Syria
Feb 18, 2019
This chart shows the towns worst impacted by chlorine attacks in Syria
More Information
Presidents' Day
Feb 18, 2019
This chart shows the average job approval ratings of U.S. presidents since January 1953.
More Information
Presidents In Movies
Feb 18, 2019
This chart shows the share of Americans who consider the following fictional president their favorite in 2019.
More Information
Corruption
Feb 18, 2019
Tis chart shows federal public corruption convictions by U.S. Judicial District from 1976 to 2016.
More Information
Amazon Headquarters
Feb 15, 2019
This chart shows information on Amazon's three headquarter locations.
More Information
Twitter Advertising
Feb 15, 2019
Year on year change in ad engagement on Twitter from Q3 2014 to Q4 2018.
More Information
Education
Feb 15, 2019
This chart shows the difference in earnings 5 years after graduation compared to avg. degree in England, by subject.
More Information
Education
Feb 15, 2019
This chart shows the difference in earnings 5 years after graduation compared to avg. degree in England, by subject.
More Information
Tech Industry
Feb 15, 2019
This chart shows the percentage of employees at U.S. tech companies who are worried about layoffs at their company.
More Information
Marginal Tax Rate
Feb 15, 2019
This chart shows the share who support introducing a 70% marginal tax rate on income over $10m.
More Information
Tech Employees
Feb 15, 2019
This chart compares the size of the global workforces of selected U.S. tech companies.
More Information
Solar Energy
Feb 15, 2019
This chart shows the number of U.S. jobs in solar energy by year.
More Information
Romatic Scams
Feb 14, 2019
This chart shows the total loss in romance related scams in the U.S. between 2015 and 2018
More Information
Defense
Feb 14, 2019
This chart shows the number of countries owning drones in 2009 and 2019, by NATO drone categories.
More Information
Survey
Feb 14, 2019
This chart shows the share that say they are looking forward a great deal/fair amount to old age in selected countries in 2018.
More Information
U.S. Politics
Feb 14, 2019
This chart shows the share of Democratic/Republican voters who would vote for member of own party who were involved in certain scandals.
More Information
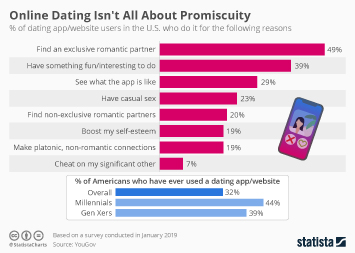
Online Dating
Feb 14, 2019
This chart shows the reasons why Americans use dating apps.
More Information
Border Wall
Feb 14, 2019
This chart shows existing and proposed structures on the U.S.-Mexico border, some that are part of a U.S. Congressional budget proposal...
More Information
Airbus
Feb 14, 2019
This chart shows annual deliveries of the Airbus A380 from 2007 to 2018.
More Information
Technology
Feb 14, 2019
This chart details survey results on video viewing habits in the United Kingdom in 2018.
More Information
Valentine's Day
Feb 13, 2019
This charts shows attitudes towards "giri choco", the practice of oligatory chocolate gift giving by Japanese employees to their co-workers...
More Information
Traffic
Feb 13, 2019
This chart shows average hours lost to congestion per driver in major U.S. cities in 2018.
More Information
Agriculture
Feb 13, 2019
This chart shows the cost of weed removal in Australia and who is paying for it.
More Information
Brexit
Feb 13, 2019
This chart shows the estimated number of jobs threatened per country in the case of a hard Brexit.
More Information
DACA
Feb 13, 2019
This chart shows figures related to approved DACA applicants as of 2018.
More Information
Immigration
Feb 12, 2019
This chart shows the percent of administrative arrests with a criminal record between FY 2016 and FY 2018.
More Information
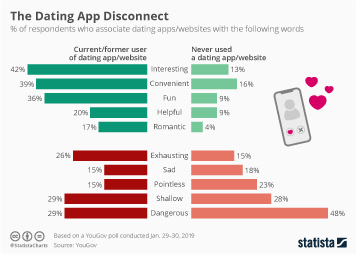
Online Dating
Feb 12, 2019
This chart shows how users and non-users of dating apps see such services.
More Information
Immigration
Feb 12, 2019
This chart shows the average daily populations of detainees in ICE-funded facilities by state in FY 2009 and FY 2017.
More Information
Technology
Feb 12, 2019
This chart shows the share of people that used the following streaming/downloading services in the UK in 2018.
More Information
College Donations
Feb 12, 2019
This chart shows the top ten U.S. colleges for donations in fiscal year 2018.
More Information
Broadband Usage
Feb 11, 2019
This chart shows the broadband speed availability and usage estimates.
More Information
Women in STEM
Feb 11, 2019
This chart shows the number of STEM degrees and certificates awarded in the U.S. by gender.
More Information
Economy
Feb 11, 2019
This chart shows year on year three-month growth rate of the UK manufacturing sector in 2018.
More Information
Google/Alphabet
Feb 11, 2019
This chart shows the growth of Google's non-advertising revenue.
More Information
National Enquirer
Feb 11, 2019
THis chart shows the paid circulation of supermarket tabloid the National Enquirer.
More Information
Alphabet
Feb 11, 2019
This chart shows Alphabet's income tax payments compared to the fines imposed by the European Commission.
More Information
Netflix Behavior
Feb 11, 2019
This chart shows the popular viewing behaviors of Netflix users who watch TV and movies with their pets, worldwide.
More Information
Insect Population
Feb 11, 2019
This chart shows the percentage decline in selected global insect populations over the past decade.
More Information
Online Porn
Feb 11, 2019
This chart shows scientific estimates on the amount of porn on the internet.
More Information
'Global Britain'
Feb 11, 2019
This chart shows official development assistance (ODA) spending in the UK from 2013 to 2017 and the main recipients.
More Information
Luxury Car Sales
Feb 11, 2019
This chart shows the total number of premium cars sold in the U.S. in 2018.
More Information
Machine Learning
Feb 8, 2019
This chart shows the biggest reasons for machine learning technology adoption in organizations worldwide.
More Information
Podcast Ads
Feb 8, 2019
This chart shows the attitudes towards ads among podcast listeners in the United States.
More Information
Measles
Feb 8, 2019
This chart shows measles cases reported in the WHO European Region in 2017 & 2018.
More Information
Twitter Earnings
Feb 8, 2019
This chart illustrates the deceleration of Twitter's user growth.
More Information
Organic Farming
Feb 8, 2019
This statistic displays the organic farmland as share of the total farmland in Europe in 2017.
More Information
Smartphone Ownership
Feb 8, 2019
This chart shows the share of adults who own no mobile phone or have a non-smartphone in 2018.
More Information
Twitter Users
Feb 7, 2019
This chart shows the daily global user base for Facebook, Twitter, and Snapchat in millions of users for Q4 2018.
More Information
President Trump
Feb 7, 2019
This chart shows the estimated costs to support Trump's four Mar-a-Lago trips from Feb 3 to Mar 5, 2017.
More Information
State of the Union
Feb 7, 2019
This chart shows immigration mentions per 10,000 words in the State of the Union address between 2001 and 2019.
More Information
Computer Ownership
Feb 6, 2019
This chart shows the percent of device ownership among U.S. teens by family income.
More Information
Internet Economy
Feb 6, 2019
This chart shows overall funding and funding rounds of Indian internet companies from 2013 to 2018.
More Information
Road Safety
Feb 6, 2019
This chart shows the European countries with the most speed cameras per 1,000km².
More Information
Social Media Advertising
Feb 5, 2019
This chart shows the social media advertising revenue in selected countries in Europe in 2018 (in million U.S. dollars).
More Information
Facebook
Feb 5, 2019
This chart shows the number of full-time Facebook employees from 2004 to 2017.
More Information
Iran
Feb 5, 2019
This chart shows key economic/social data about Iran.
More Information
Consulting Industry
Feb 5, 2019
This chart shows a count of topics from select consulting publications between 2016 to 2018.
More Information
E-Scooters
Feb 5, 2019
This chart shows electric scooter injuries and accidents in Southern California.
More Information
Super Bowl LIII
Feb 4, 2019
This chart shows th number of points scored in the lowest-scoring Super Bowls in NFL history.
More Information
Hemp
Feb 4, 2019
This chart shows acres of industrial hemp cultivated in the biggest-producing U.S. states and legalization dates for medical and recreational...
More Information
White House
Feb 4, 2019
This chart shows a category breakdown of president Trumps schedule between Nov 7, 2018 and Feb 1, 2019.
More Information
Meat Consumption
Feb 4, 2019
This chart shows the number of animals (livestock) slaughtered for meat each year.
More Information
Airlines
Feb 4, 2019
This chart shows the quarterly profit/loss of Ryanair Holdings plc and Subsidiaries in FY2019.
More Information
Public Opinion
Feb 1, 2019
This chart shows statistics on American perceptions of the U.S. and UK political situation.
More Information
Women in News
Feb 1, 2019
This chart shows the percent of bylines by gender across news types.
More Information
Six Nations
Feb 1, 2019
This chart shows players who have scored at least 250 points in the Five/Six Nations.
More Information
Six Nations
Feb 1, 2019
This chart shows the players with the most tries in the Five/Six Nations.
More Information
Brexit
Feb 1, 2019
This chart shows how many UK companies have indicated that they want to move because of Brexit.
More Information
Polar Vortex
Feb 1, 2019
This chart shows the all-time low temperatures by state and low temperatures recorded during the polar vortex 2019.
More Information
Polar Vortex
Feb 1, 2019
This chart show the lowest temperature recorded on Jan 30, 2019 (°F).
More Information
Polar Vortex
Feb 1, 2019
This chart shows temperatures during the Midwestern Cold Snap on Jan 30 compared to record lows in select cities.
More Information
Facebook
Jan 31, 2019
This chart shows Facebook's average revenue per user from Q4 2011 to Q4 2018.
More Information
Immigration
Jan 31, 2019
This chart shows the estimated percentage of the population that was foreign-born in 2017.
More Information
Infectious Disease
Jan 31, 2019
This chart shows annual measles cases in the U.S. and states with below-average vaccination rates.
More Information
UK Prison System
Jan 31, 2019
This chart shows the number of incidents of self-harm in prisons in England and Wales.
More Information
EU Heating Costs
Jan 31, 2019
This chart shows the share of the population who couldn't afford to keep their home adequately warm in 2017.
More Information
Facebook
Jan 31, 2019
This chart shows Facebook's daily active user growth and average revenue per user in Q4 2018, by region.
More Information
Robocalls
Jan 31, 2019
This chart shows the number of robocalls received by category in the U.S. in 2018.
More Information
Apple
Jan 30, 2019
This chart shows Apple's quarterly revenue by geographic segment.
More Information
101
/
161
Contact
Get in touch with us. We are happy to help.
Do you still have questions?
Feel free to contact us anytime using our
contact form
or visit our
FAQ page
.
Your contact to the Infographics Newsroom
Felix Richter
Data Journalist
felix.richter@statista.com
+49 (40) 284 841 557