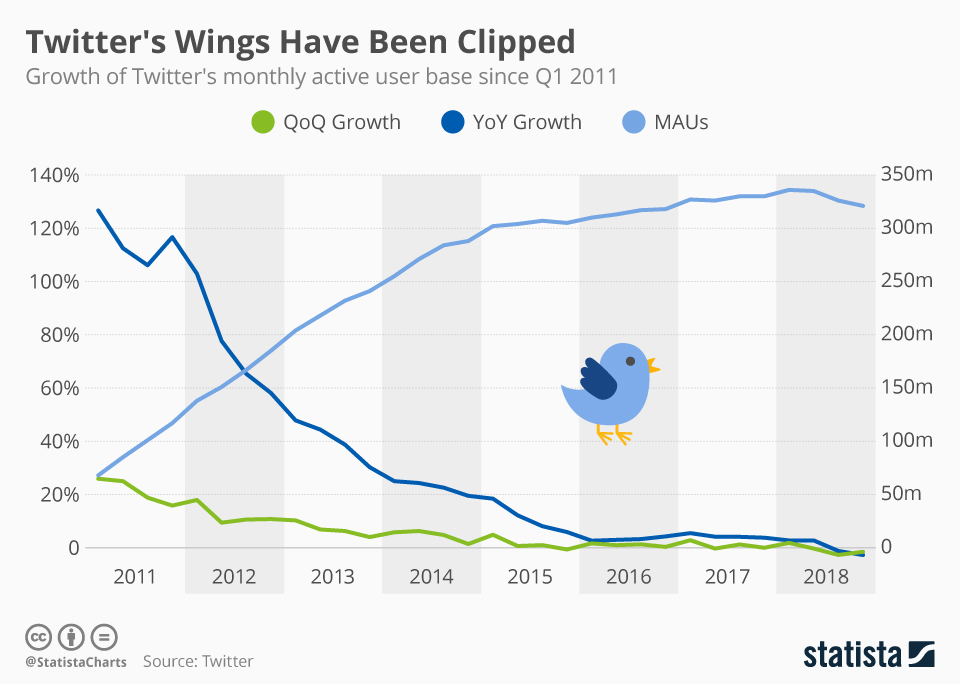
Despite beating expectations on both the top and bottom line in its fourth quarter earnings report on Thursday morning, Twitter’s share price fell nearly 10 percent during the day. The reason for the harsh market reaction was the same old problem that the company has been having for years now: disappointing (or in this case non-existent) user growth. Twitter’s monthly active user base shrank by 9 million users in the fourth quarter compared to Q4 2017, marking the third consecutive quarter of negative growth for President Trump’s digital megaphone.
Advertisement
Advertisement
Advertisement
Related Infographics
FAQ
- The Statista "Chart of the Day", made available under the Creative Commons License CC BY-ND 3.0, may be used and displayed without charge by all commercial and non-commercial websites. Use is, however, only permitted with proper attribution to Statista. When publishing one of these graphics, please include a backlink to the respective infographic URL. More Information
- The Statista "Chart of the Day" currently focuses on two sectors: "Media and Technology", updated daily and featuring the latest statistics from the media, internet, telecommunications and consumer electronics industries; and "Economy and Society", which current data from the United States and around the world relating to economic and political issues as well as sports and entertainment.
- For individual content and infographics in your Corporate Design, please visit our agency website www.statista.design
Any more questions?
Get in touch with us quickly and easily.
We are happy to help!
Do you still have questions?
Feel free to contact us anytime using our contact form or visit our FAQ page.
Your contact to the Infographics Newsroom


Statista Content & Design
Need infographics, animated videos, presentations, data research or social media charts?
Advertisement