Skip to main content
Consumer Goods & FMCG
E-Commerce
Economy & Politics
Energy & Environment
Health, Pharma & Medtech
Internet
Media
Technology & Telecommunications
Transportation & Logistics
Travel, Tourism & Hospitality
View all industries
Global data volume growth
Global AI market size
Number of generative AI users worldwide
Global inflation rate
Retail e-commerce sales worldwide
Largest economies worldwide
Biggest social media platforms by users
Global EV market share by manufacturer
International tourist arrivals by world region
Global annual CO₂ emissions
Browse recent statistics
Artificial intelligence (AI) worldwide
TikTok
Nvidia
E-commerce worldwide
Global GDP
Instagram
Apparel market worldwide
Video gaming worldwide
Global renewable energy industry
Influencer marketing worldwide
Browse recent topics
Consumer Trends 2026
Artificial Intelligence: in-depth market analysis
E-commerce challenges
Global economy
TikTok
Luxury goods: in-depth market analysis
Electric vehicles: A global overview
Video gaming worldwide
Travel and tourism trends 2026
Battery recycling worldwide
Browse recent reports
Explore the tool
Explore Classic mode
Advertising & Media
eCommerce
Consumer
Finance
Global Indicators
Health
Industrial
Mobility
Technology
Explore Market Insights
eCommerce Insights
Research AI
Book a demo
All integrations
Developer docs
Explore Statista Connect
Research
Strategy & Consulting
Marketing
Media & PR
Explore AI assistants
Marketing
Research & Development
Strategy
Sales
Find the fact
Tell the story
Win the pitch
Understand the market
Develop your strategy
Academia
Agencies
Consultancies
Consumer goods
Finance
Tech
Research solutions
Strategy consulting
Communication services
Explore Statista+
Statista R
Statista Healthcare
About Statista
First steps & help center
Webinar & training hub
Success stories
Individuals & Small Teams
Businesses & Enterprises
Academia & Government
English
Deutsch
Daily Data
Global stories vividly visualized
Teens and Tech
Sep 13, 2018
This chart shows the change in social media habits of 13-17 year old teenagers in the U.S. between 2012 and 2018.
More Information
Russia Investigation
Sep 13, 2018
This chart shows the percent that approve of how Donald Trump and Robert Mueller handle the Russia investigation.
More Information
Luxury Goods
Sep 13, 2018
This chart shows the percent change in global luxury good investments over the past year.
More Information
Gloabl Emotions
Sep 13, 2018
This chart shows the negative experience index from 2006--2017.
More Information
Battle of Britain
Sep 13, 2018
This chart shows non-British aircrew who served and died in the Battle of Britain.
More Information
Survey
Sep 12, 2018
This chart shows the net favorability score of U.S. business sectors in August 2018.
More Information
Jobs
Sep 12, 2018
This chart shows the jobs with the fastest rates of growth in Australia from 2013 to 2017.
More Information
Economy
Sep 12, 2018
This chart shows the U.S. dollar (USD) to Indian rupee (INR) exchange rate in 2017/18.
More Information
New York Times Op-Ed
Sep 12, 2018
This chart shows the share believing the anonymously-published allegations in the op-ed.
More Information
Sexuality
Sep 11, 2018
This chart shows a global overview of the rights and persecution of LGB people.
More Information
Plastic Waste
Sep 11, 2018
This chart shows the composition and size of the Great Pacific Garbage Patch.
More Information
iPhone Unveiling
Sep 11, 2018
This chart shows the most wanted features in Apple's new iPhones to be announced on Sept. 12, 2018
More Information
New Ranking
Sep 11, 2018
This chart shows the business schools with the highest average salaries of management masters graduates in 2018.
More Information
Japan
Sep 11, 2018
This chart shows advertising expenses through tradtional media in Japan in 2017, by industry.
More Information
Ireland
Sep 11, 2018
This chart shows the share of 15 to 16-year old students in Ireland who have ever used the following substances.
More Information
United Kingdom
Sep 11, 2018
If you remained healthy, how long would you want to live for?
More Information
Ireland
Sep 11, 2018
This chart shows the share of adults in Ireland reporting use of the following substances in the past year.
More Information
Commuting
Sep 11, 2018
This chart shows the share of U.S. workers aged 18+ who commute to work using the following means.
More Information
Education Spending
Sep 10, 2018
This chart shows the average spending per student by country in U.S. dollars.
More Information
US Economy
Sep 10, 2018
This chart shows the jobs added by sector in the US economy for August 2018.
More Information
Pay-TV
Sep 10, 2018
This chart shows the most important reasons for Americans to keep their pay-TV subscription.
More Information
Russia
Sep 10, 2018
This chart shows the number of personnel involved in Russian military exercises by month from 2013 to 2018.
More Information
Wind Energy
Sep 10, 2018
This chart shows the top 10 offshore windfarms worldwide by capacity (in megawatts).
More Information
Search Engines
Sep 7, 2018
This chart shows the percent of U.S. adults who think search engine results are biased to favor ideological groups.
More Information
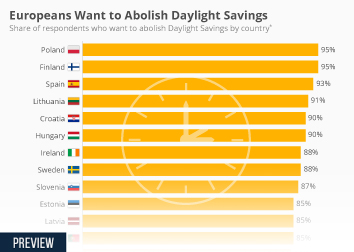
Daylight Savings
Sep 7, 2018
This chart shows the share of respondents who want to abolish Daylight Savings by country.
More Information
4K TV
Sep 7, 2018
This chart shows estimated global 4K TV sales since 2014.
More Information
Nike Ad
Sep 6, 2018
This chart shows the percent of U.S. consumers who have a positive opinion of former NFL quarterback Colin Kaepernick.
More Information
NFL
Sep 6, 2018
This chart shows television viewership of the NFL regular season from 2010 to 2017 in millions of viewers.
More Information
Supreme Court
Sep 6, 2018
This chart shows the number of unique issues brought up during select Supreme Court nominee hearings.
More Information
Movie Industry
Sep 6, 2018
This chart shows summer box office earnings in the United States and Canada.
More Information
Facebook
Sep 6, 2018
This chart shows, which measures Facebook users have taken in the past year.
More Information
Consumer Price Index
Sep 6, 2018
This chart shows European countries by EU28 consumer price index.
More Information
NHS
Sep 6, 2018
This chart shows the share that agree their country's healthcare system is overstretched.
More Information
Best Employers For Grads
Sep 6, 2018
This chart shows the top 10 employers for young professionals in the U.S. in 2018.
More Information
Health
Sep 6, 2018
This chart shows the share saying that in case of sudden death they would allow their organs to be removed to help others in need.
More Information
Media Consumption
Sep 5, 2018
This chart shows survey results regarding how college students view the press.
More Information
Seasonal Drinks
Sep 5, 2018
This chart shows Google search interest for Starbucks' pumpkin spice in the U.S. from 2004-2017.
More Information
College Majors
Sep 5, 2018
This chart shows the share of unemployed recent college graduates in the U.S. by selected majors.
More Information
FMCG
Sep 5, 2018
This chart shows the per capita consumption of pure alcohol in Australia, by type (wine and beer) .
More Information
Technology
Sep 4, 2018
This chart shows the market share of electric cars in Japan from 2009 to 2017.
More Information
Google
Sep 4, 2018
The following chart sums up some interesting facts from 20 years of Google.
More Information
Ireland
Sep 4, 2018
This chart shows the share of male and female students getting Grade 1 in higher level Maths and History.
More Information
Ireland
Sep 4, 2018
This chart shows the share of male and female students getting Grade 1 in higher level Irish and English.
More Information
Campbell Soup
Sep 4, 2018
This chart shows the global operating earnings of Campbell Soup Company, by division in millions of USD.
More Information
Sport
Sep 4, 2018
This chart shows the reported value of the largest transfers in the 2018 summer window.
More Information
UK Politics
Sep 4, 2018
This chart shows the results of a survey on how different new party leaders would affect the Conservatives' chances of winning the...
More Information
AR/VR
Sep 3, 2018
THis chart shows a forecast of AR and VR device shipments in 2018 and 2022.
More Information
Employment
Sep 3, 2018
This chart shows the monthly unemployment rate of women in the U.S. from July 2017 to July 2018.
More Information
Working Abroad
Sep 3, 2018
This chart shows the share of people willing to move to the following countries for work.
More Information
Fresh Fruit
Aug 31, 2018
This chart shows annual production of different apple varieties in the U.S. in million 42-pound units.
More Information
Migration
Aug 31, 2018
This chart shows the main destinations for migrants from Venezuela in 2017.
More Information
Aretha Franklin
Aug 31, 2018
This chart shows a timeline for Aretha Franklin's life.
More Information
United Kingom
Aug 31, 2018
This chart shows the projected number of people aged 85 and over with high-dependency care needs in the UK from 2015 to 2035.
More Information
Seaborne Freight
Aug 31, 2018
This chart shows the northern and southern sea routes between Europe and East Asia in comparison.
More Information
Government Spending
Aug 30, 2018
This chart shows the maximum daily rate for travelling government officials by select cities in U.S. dollars.
More Information
Fortnite
Aug 30, 2018
This chart shows key figures related to Twitch and Youtube accounts of pro gamer and streamer 'Ninja'.
More Information
Facebook
Aug 30, 2018
This chart shows the level of awareness/usage of Facebook Watch among U.S. adults in 2018.
More Information
England
Aug 30, 2018
This chart shows the share of people in the EU that consume energy drinks, by age group.
More Information
10-Year Mortgages
Aug 30, 2018
This chart shows the average interest rate of 10-year fixed mortgages in selected European countries in June 2018.
More Information
Commercial Aviation
Aug 30, 2018
This chart shows estimated new pilot demand by region from 2018 to 2037.
More Information
Food Insecurity
Aug 29, 2018
This chart shows the share of adults surveyed on different indicators for food insecurity.
More Information
E-Cigarettes
Aug 29, 2018
This chart shows statistics on e-cigarette revenue growth.
More Information
Europe
Aug 29, 2018
This chart shows the share of people very/somewhat proud to identify as European in 2017.
More Information
Advertising
Aug 29, 2018
This chart shows out-of-home ad spending in the U.S. from 2009 to 2017.
More Information
Australia
Aug 29, 2018
This chart shows the share of women per ICT occupation in Australia in 2017.
More Information
Social Media Stories
Aug 29, 2018
This chart shows the percentage of Americans aged 16-34 who create/consume stories on social media platforms.
More Information
Puerto Rico
Aug 29, 2018
This chart shows the Puerto Rican government's initial and revised death tolls for Hurricane Maria.
More Information
Trade
Aug 28, 2018
More Information
Data Security
Aug 28, 2018
This chart shows the percentage of U.S. consumers confident that their data is kept secure by the following institutions.
More Information
Storms
Aug 28, 2018
This chart shows tropical cyclones in the U.S. with the most precipitation in inches.
More Information
India
Aug 28, 2018
This chart shows key data regarding the severe flooding in the Indian state of Kerala in 2018.
More Information
Myanmar
Aug 28, 2018
This chart shows high-profile honours to Aung San Suu Kyi which have been revoked.
More Information
Student Debt
Aug 28, 2018
This chart shows outstanding student loans in the U.S. from 2006 to 2018 (in trillion U.S. dollars).
More Information
Life Expectancy
Aug 27, 2018
This chart shows the life expectancy and number of homicides in New York City overtime.
More Information
Property Value
Aug 27, 2018
This chart shows the top southeastern U.S. cities by total property value lost from 2005-2017.
More Information
Back-to-college
Aug 27, 2018
This chart shows what households of college students spend money on during back-to-college season.
More Information
UK
Aug 27, 2018
This chart shows the preferred working hours of employees in the UK in 2018.
More Information
Trump
Aug 27, 2018
This chart shows the U.S. public opinion on whether it would be appropriate for President Trump to pardon Manafort or Cohen.
More Information
European Union
Aug 27, 2018
This chart shows price levels in the EU-28 above and below the EU average (2017).
More Information
Ireland
Aug 27, 2018
This chart shows papal mass attendance in Dublin's Phoenix Park in 1979 and 2018.
More Information
Alcohol-Attributable Deaths
Aug 27, 2018
This chart shows the countries with the highest number of deaths attributable to alcohol in 2016.
More Information
Stock Market
Aug 24, 2018
This chart shows consecutive bull days since World War II, by end date.
More Information
Prison Wages
Aug 24, 2018
This chart shows the hourly prison wages in state-owned businesses for selected states in 2017.
More Information
Data Collection
Aug 24, 2018
This chart shows how often Android phones and iPhones send information to Google and Apple servers.
More Information
Japan
Aug 24, 2018
This chart shows the cross-border e-commerce market size in Japan from fiscal year 2017 to 2021.
More Information
Artists
Aug 24, 2018
This chart shows the density of artists per 1,000 inhabitants in August 2018.
More Information
China
Aug 24, 2018
This chart shows the number of internet users in China (millions).
More Information
Information Security
Aug 23, 2018
This chart shows estimated worldwide spending on information security products and services by segment.
More Information
Smartphone addiction
Aug 23, 2018
This chart shows how many teenagers in the U.S. think they spend too much time using their cell phone, on social media or playing video...
More Information
Waste
Aug 23, 2018
This chart shows a collection of statistics on the disposal of contact lenses in the U.S. for 2018.
More Information
108
/
161
Contact
Get in touch with us. We are happy to help.
Do you still have questions?
Feel free to contact us anytime using our
contact form
or visit our
FAQ page
.
Your contact to the Infographics Newsroom
Felix Richter
Data Journalist
felix.richter@statista.com
+49 (40) 284 841 557