As most of you probably know, smartphones have the ability to gather a lot of information about its users. But how often do our favorite mobile devices actually “phone home” and share information with Google and Apple, i.e. the companies behind Android and iOS?
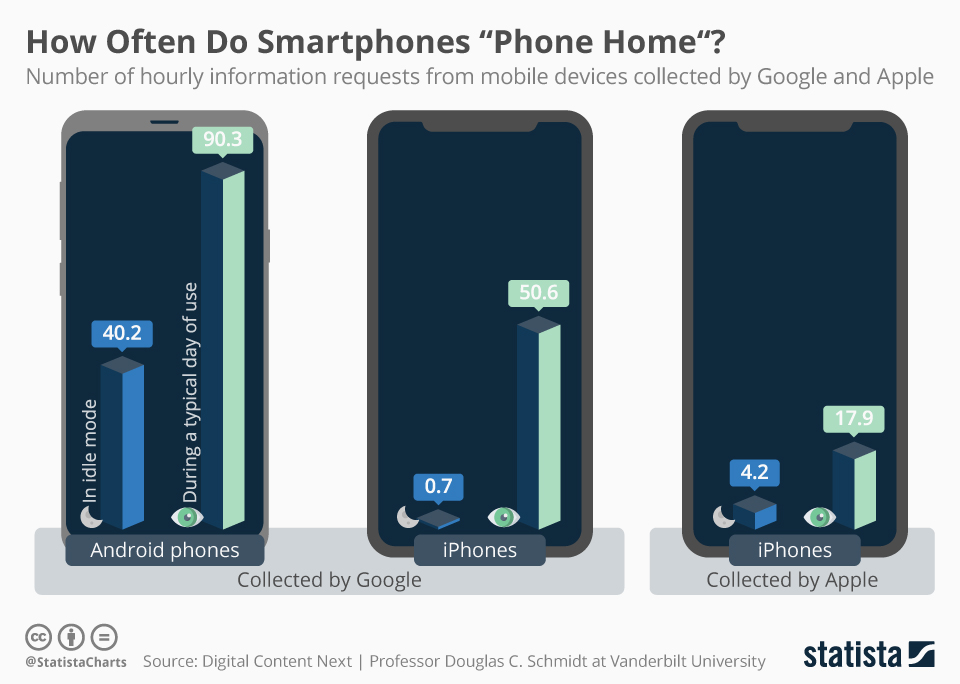
According to a new study conducted by Professor Douglas C. Schmidt, Professor of Computer Science at Vanderbilt University, and published by Digital Content Next, Google in particular likes to keep tabs on its users. The study analyzed how often Android phones and iPhones send information to Google’s and Apple’s servers during a 24-hour period, distinguishing between the amount of data collected in idle mode and during normal use. The results are pretty clear: even when not used, Android phones send information to Google around 40 times per hour, compared to just 4 times iPhones send info to Apple’s servers. During normal use, that total rises to 90 information requests per hour for Android phones compared to 18 for iPhones. Interestingly Google even collects more data from iPhone users than Apple itself does. This however, only works when the phone is used. In idle mode iPhones very rarely communicate with Google’s servers.
While these results seem consistent with Google’s reputation as a data hog, the company has already challenged the findings, calling them “wildly misleading” and suggesting the author had a conflict of interest because he served as a witness against Google in a copyright case between the company and Oracle. The fact is, that the search giant has repeatedly faced criticism over the way it collects data in the past. Just this month, an AP investigation uncovered that Google stores the location of Android and iPhone users even if the users’ privacy settings say otherwise.
How Often Do Smartphones "Phone Home"?
Data Collection

Description
This chart shows how often Android phones and iPhones send information to Google and Apple servers.


