Skip to main content
Consumer Goods & FMCG
E-Commerce
Economy & Politics
Energy & Environment
Health, Pharma & Medtech
Internet
Media
Technology & Telecommunications
Transportation & Logistics
Travel, Tourism & Hospitality
View all industries
Global data volume growth
Global AI market size
Number of generative AI users worldwide
Global inflation rate
Retail e-commerce sales worldwide
Largest economies worldwide
Biggest social media platforms by users
Global EV market share by manufacturer
International tourist arrivals by world region
Global annual CO₂ emissions
Browse recent statistics
Artificial intelligence (AI) worldwide
TikTok
Nvidia
E-commerce worldwide
Global GDP
Instagram
Apparel market worldwide
Video gaming worldwide
Global renewable energy industry
Influencer marketing worldwide
Browse recent topics
Consumer Trends 2026
Artificial Intelligence: in-depth market analysis
E-commerce challenges
Global economy
TikTok
Luxury goods: in-depth market analysis
Electric vehicles: A global overview
Video gaming worldwide
Travel and tourism trends 2026
Battery recycling worldwide
Browse recent reports
Explore the tool
Explore Classic mode
Advertising & Media
eCommerce
Consumer
Finance
Global Indicators
Health
Industrial
Mobility
Technology
Explore Market Insights
eCommerce Insights
Research AI
Book a demo
All integrations
Developer docs
Explore Statista Connect
Research
Strategy & Consulting
Marketing
Media & PR
Explore AI assistants
Marketing
Research & Development
Strategy
Sales
Find the fact
Tell the story
Win the pitch
Understand the market
Develop your strategy
Academia
Agencies
Consultancies
Consumer goods
Finance
Tech
Research solutions
Strategy consulting
Communication services
Explore Statista+
Statista R
Statista Healthcare
About Statista
First steps & help center
Webinar & training hub
Success stories
Individuals & Small Teams
Businesses & Enterprises
Academia & Government
English
Deutsch
Daily Data
Global stories vividly visualized
Wine
Apr 25, 2018
This chart shows the production and consumption of wine worldwide (in million hectoliters)
More Information
Smart assistants
Apr 25, 2018
This chart shows how well digital voice assistants can answer basic questions.
More Information
YouTube
Apr 25, 2018
This chart shows human-reported flags sent to YouTube (Oct-Dec '17).
More Information
Bird Populations
Apr 24, 2018
This chart shows the global conservation status of total extant bird species in 2018.
More Information
U.S. Politics
Apr 24, 2018
This chart shows the share of U.S. voters saying the incumbent president deserves re-election (from Clinton to Trump).
More Information
Google
Apr 24, 2018
This graph shows Alphabet's total revenue in comparison to its revenue generated through advertising
More Information
Delivery Costs
Apr 24, 2018
This chart shows the average price of a normal birth in the private sector in 2015* (in U.S. Dollars)
More Information
Tech
Apr 24, 2018
This chart shows the main uses people in the UK have for their smart speakers (2018).
More Information
Brits Abroad
Apr 24, 2018
This chart shows the number of UK citizens arrested/detained while abroad, by country.
More Information
Marijuana
Apr 24, 2018
This chart shows disclosed funding by marijuana company and category in 2018.
More Information
Migration
Apr 23, 2018
Number of successful H-1B visa applications for leading U.S. tech companies
More Information
World Book Day
Apr 23, 2018
This chart shows average time spent reading books per day.
More Information
Afghanistan
Apr 23, 2018
This chart shows Taliban presence in Afghanistan by grade of control over districts
More Information
Beer
Apr 23, 2018
This chart shows some key facts behind the German beer industry.
More Information
Housing
Apr 23, 2018
This chart shows the annual change of the average UK house price from February 2017 to February 2018.
More Information
Housing
Apr 23, 2018
This chart shows the average house price in the UK and monthly/annual changes, by region.
More Information
Magicians
Apr 20, 2018
This chart shows the highest-paid magicians/magic acts worldwide in 2017.
More Information
Music Industry
Apr 19, 2018
This chart shows the number of LP albums sold in the UK from 2003 to 2017.
More Information
Smart Speakers
Apr 19, 2018
This chart shows the percentage of U.S. Wi-Fi households with at least one active smart speaker.
More Information
Environmental Issues
Apr 19, 2018
This infographic shows the worldwide carbon emissions from fossil fuel consumption and cement production (in m metric tons)
More Information
Airlines
Apr 19, 2018
This chart shows the share of female pilots at commercial airlines in 2018.
More Information
Wolf Population
Apr 19, 2018
This chart shows data on the German wolf population.
More Information
Vinyl Revival
Apr 19, 2018
This graph shows the distribution of vinyl buyers by turntable ownership and usage.
More Information
E-Commerce
Apr 19, 2018
This chart ranks online retailers in the United States by the amount of time consumers spent on their respective websites/apps in December...
More Information
Air Pollution
Apr 19, 2018
This chart shows age-standardized deaths per 100,000 people attributable to air pollution (2016).
More Information
Car Drivers
Apr 18, 2018
This chart shows the number of new Dacia Sanderos you could buy for the price of the following.
More Information
Mobility Services
Apr 18, 2018
The following chart shows which mobility services U.S. Americans have booked online in the past 12 months.
More Information
$10,000
Apr 18, 2018
This graph shows how the respondents would invest $10,000 of tax-free money.
More Information
Computing Sector
Apr 18, 2018
This chart shows the largest computing workforces & highest number of unfilled jobs by state in 2018.
More Information
Amazon
Apr 17, 2018
This chart shows the share of Amazon employees in the UK who have experienced the following.
More Information
Syrian Refugees
Apr 17, 2018
This chart shows the number of Syrian refugees resettled in the U.S. by year.
More Information
Retail Stores in the United States
Apr 17, 2018
This chart shows the change in the number of retail stores in the U.S. between 2007 and 2017, by category.
More Information
U.S. Politics
Apr 16, 2018
This chart shows the result of a survey on who is seen as being most believable - Donald Trump or James Comey.
More Information
Syria
Apr 16, 2018
This chart shows the number of confirmed chemical attacks in Syria (2013-2017).
More Information
Plastic Pollution
Apr 16, 2018
This chart shows views on how to tackle plastic waste among people in the UK.
More Information
Self-Driving Cars
Apr 16, 2018
This chart shows the share in favor, unsure about and against self-driving cars in selected countries in 2018.
More Information
Military
Apr 13, 2018
This chart shows public opinion on potential missile strikes against Syrian government military targets (April 2018).
More Information
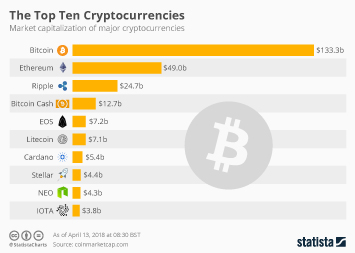
Bitcoin
Apr 13, 2018
This chart shows the mrket capitalization of major cryptocurrencies.
More Information
Syria
Apr 13, 2018
This chart shows the estimated number of displaced Syrians in 2017.
More Information
Data Protection
Apr 13, 2018
This chart shows the share of executives whose companies have taken following measures in preparation for GDPR*
More Information
Podcasts
Apr 13, 2018
This chart shows Increases in consumer purchasing intent after listening to podcasts, by genre (in percent)
More Information
US Cabinet
Apr 13, 2018
This chart shows the US presidents' initial cabinet's net worth and its five richest cabinet members.
More Information
Parking
Apr 13, 2018
This chart shows the average amount drivers spent on parking in major U.S. cities in 2017.
More Information
Spice Girls
Apr 13, 2018
This chart shows the Spice Girls ranked by their popularity and their fanbase's interest in sports.
More Information
Explosive Violence
Apr 12, 2018
This chart shows the number of casualties and civilian share as a result of explosive violence in 2017*
More Information
Sports
Apr 12, 2018
This chart shows the share of respondents who claim not to never exercise or do sports.
More Information
Military & Defense
Apr 12, 2018
This chart shows instances in which Tomahawk cruise missiles were employed by the U.S. military on a larger scale
More Information
Property
Apr 12, 2018
This chart shows the 12-month percentage change in property prices by city from Q4 2016 to Q4 2017.
More Information
U.S. Politics
Apr 11, 2018
This chart reveals the most used hashtags on Twitter by congressional Republicans and Democrats in Q1 2018.
More Information
Electricity
Apr 11, 2018
This chart shows the share of the population with access to electricity in 2014.
More Information
Pet Euthanasia
Apr 11, 2018
This chart shows the estimated number of cats and
More Information
Trade & Tariffs
Apr 11, 2018
This chart shows the biggest industries possibly negatively affected by Chinese tariffs, by # of people employed
More Information
Renewable Energy
Apr 11, 2018
This infographic shows worldwide new investment in the renewable energy sector (in billion U.S. dollars)
More Information
U.S. Military Aviation
Apr 11, 2018
This chart shows accidents involving U.S. military aircraft from April 2017 to April 2018.
More Information
Bike-Sharing
Apr 10, 2018
This chart illustrates the global rise of bike-sharing programs.
More Information
Uber and Co.
Apr 10, 2018
This Graph shows Yearly Taxi pickup in New York City compared to Ride-Hailing Apps
More Information
United Kingdom
Apr 10, 2018
This chart shows the opinion of financial decision makers on the gender pay gap in their own company and UK companies generally in...
More Information
Skripal Poisoning
Apr 10, 2018
This chart shows responses to the question "do you think the Russian state was or not responsible" for the Skripal poisoning?
More Information
News & Media
Apr 10, 2018
This chart shows respondents views on outside groups or agents actively trying to plant fake news (in %)
More Information
Equal Pay Day
Apr 10, 2018
This chart shows the share of respondents who think equal pay is a top issue facing women and girls, by country
More Information
Syria
Apr 9, 2018
Iranian bases and known Israeli airstrikes on facilities in Syria.
More Information
Drugs
Apr 9, 2018
This chart shows the rate of heroin/morphine deaths per 100,000 population, by local authority district in England and Wales.
More Information
Electric Cars
Apr 9, 2018
This chart shows the number of public and workplace charging points for electric vehicles in the U.S.
More Information
Tech
Apr 9, 2018
This chart shows the results of a worldwide survey into how people would spend their time in an autonomous car.
More Information
Politics in Brazil
Apr 9, 2018
This graph shows Brazilian MPs receiving the most donations by companies promoting modern day slavery
More Information
Home Ownership
Apr 9, 2018
This salary required to buy a home in U.S. cities in 2018.
More Information
World Health Day
Apr 6, 2018
This Graph shows the affordability of health care services in elected EU countries (2016)
More Information
Self-Driving Cars
Apr 6, 2018
This chart shows the results of two surveys regarding the safety of self-driving cars.
More Information
FT 1000
Apr 6, 2018
This chart shows the ranking of the fastest growing companies in Europe by revenue growth.
More Information
Music
Apr 5, 2018
This graph shows the vocabulary of Wu-Tang Clan artists in comparison to Shakespeare and Melville
More Information
Facebook
Apr 5, 2018
This chart shows users whose Facebook data may have been improperly shared with Cambridge Analytica.
More Information
H-1B Visas
Apr 5, 2018
This chart shows the total number of H-1B visa approvals per metropolitan area (2010-2016).
More Information
YouTube Shooting
Apr 4, 2018
This chart shows the number of mass shootings in the U.S. from 1982 to February 2018, by the shooter's gender.
More Information
Brexit
Apr 4, 2018
This chart shows UK-based banking jobs that will be relocated to EU hubs.
More Information
Politics
Apr 3, 2018
This infographic shows a timeline of Vladimir Putin and Recep Tayyip Erdogan in power as prime ministers or presidents
More Information
Music Industry
Apr 3, 2018
Gross payout to labels per stream by selected streaming services
More Information
Brazil
Apr 3, 2018
This chart shows responses to the question: "should Luiz Inácio Lula da Silva be arrested/allowed to run in the election?"
More Information
Social Media
Apr 3, 2018
This chart shows the share of UK children spending more than 3 hours using social networking websites on a normal school day.
More Information
Conservation
Apr 3, 2018
This chart presents selected facts and figures on the global ivory trade.
More Information
Autonomous Cars
Apr 3, 2018
This chart shows the share of U.S. adults that would find the certain forms of advertising useful in an autonomous car.
More Information
Murders
Apr 3, 2018
This chart shows the number of murders in New York and London in 2018.
More Information
Easter
Mar 29, 2018
This chart illustrates some of the results of Statista's Easter Survey 2018.
More Information
Wall Street Bonuses
Mar 29, 2018
This chart shows bonuses paid to New York City workers in the financial securities industry.
More Information
Classroom Tech
Mar 28, 2018
This chart shows the platform share of mobile computing devices shipped to schools (K-12) in the United States.
More Information
School
Mar 28, 2018
This chart shows the age from which school is compulsory in Europe in 2017.
More Information
Bonus Bonanza
Mar 28, 2018
This infographic shows median U.S. household income and average bonuses of N.Y.C. security industry employees* (in $)
More Information
Yemen Conflict
Mar 28, 2018
This chart shows the type and range of missiles in the Houthi rebel arsenal in 2018.
More Information
Facebook
Mar 28, 2018
This chart shows the share in the U.S. trusting the following to obey laws protecting personal information.
More Information
Russia
Mar 28, 2018
This chart shows selected deadly blazes at public locations in Russia
More Information
United Kingdom
Mar 27, 2018
This chart shows the number of antisemitic incidents recorded by Community Security Trust in the UK from 2012 to 2017.
More Information
115
/
161
Contact
Get in touch with us. We are happy to help.
Do you still have questions?
Feel free to contact us anytime using our
contact form
or visit our
FAQ page
.
Your contact to the Infographics Newsroom
Felix Richter
Data Journalist
felix.richter@statista.com
+49 (40) 284 841 557