Skip to main content
Consumer Goods & FMCG
E-Commerce
Economy & Politics
Energy & Environment
Health, Pharma & Medtech
Internet
Media
Technology & Telecommunications
Transportation & Logistics
Travel, Tourism & Hospitality
View all industries
Global data volume growth
Global AI market size
Number of generative AI users worldwide
Global inflation rate
Retail e-commerce sales worldwide
Largest economies worldwide
Biggest social media platforms by users
Global EV market share by manufacturer
International tourist arrivals by world region
Global annual CO₂ emissions
Browse recent statistics
Artificial intelligence (AI) worldwide
TikTok
Nvidia
E-commerce worldwide
Global GDP
Instagram
Apparel market worldwide
Video gaming worldwide
Global renewable energy industry
Influencer marketing worldwide
Browse recent topics
Consumer Trends 2026
Artificial Intelligence: in-depth market analysis
E-commerce challenges
Global economy
TikTok
Luxury goods: in-depth market analysis
Electric vehicles: A global overview
Video gaming worldwide
Travel and tourism trends 2026
Battery recycling worldwide
Browse recent reports
Explore the tool
Explore Classic mode
Advertising & Media
eCommerce
Consumer
Finance
Global Indicators
Health
Industrial
Mobility
Technology
Explore Market Insights
eCommerce Insights
Research AI
Book a demo
All integrations
Developer docs
Explore Statista Connect
Research
Strategy & Consulting
Marketing
Media & PR
Explore AI assistants
Marketing
Research & Development
Strategy
Sales
Find the fact
Tell the story
Win the pitch
Understand the market
Develop your strategy
Academia
Agencies
Consultancies
Consumer goods
Finance
Tech
Research solutions
Strategy consulting
Communication services
Explore Statista+
Statista R
Statista Healthcare
About Statista
First steps & help center
Webinar & training hub
Success stories
Individuals & Small Teams
Businesses & Enterprises
Academia & Government
English
Deutsch
Daily Data
Global stories vividly visualized
Health
Nov 13, 2017
This chart shows medical graduates per 100,000 of the population in 2015.
More Information
Quarterly Report 2017
Nov 10, 2017
This chart shows Viacom's revenue and net income from 2006 to 2016 (in billion U.S. dollars).
More Information
Holiday shopping
Nov 10, 2017
This chart shows how many Americans plan to go shopping or shop online on Thanksgiving weekend.
More Information
Germany
Nov 10, 2017
This chart shows Trabant production from 1957 to 1991 and number still registered in Germany,
More Information
Foreign Policy
Nov 10, 2017
This chart shows six remarks by Donald Trump on China, before and while being U.S. president
More Information
Poland
Nov 10, 2017
This chart shows the number of Polish emigrants and a survey as to whether they are likely to return to their home country.
More Information
Google Street View
Nov 10, 2017
This chart shows countries and dependencies with full/partial Google Street View coverage in 2017.
More Information
Yemen
Nov 10, 2017
This chart shows the cumulative number of suspected cholera cases and deaths in Yemen (Jul-Nov 2017).
More Information
International Series - Polish
Nov 10, 2017
Part of Statista's International Series: Polscy migranci w Europie – czy wrócą do domu?
More Information
Roku
Nov 9, 2017
This chart shows the aggregate number of hours streamed on Roku's streaming devices.
More Information
Business
Nov 9, 2017
This chart shows the largest fintech deals in Europe in Q3 2017.
More Information
Social Media
Nov 9, 2017
This chart shows the Instagram accounts of sports stars with the most followers in Winter 2017.
More Information
London
Nov 9, 2017
This chart shows the share of Londoners who have visited the following attractions.
More Information
Civil Rights
Nov 9, 2017
This chart shows the number of countries with freedom of information laws
More Information
Video on Demand
Nov 9, 2017
This chart shows top five countries worldwide with the highest share of visitors on Netflix.com in November 2017
More Information
Online Advertising
Nov 9, 2017
This infographic shows reasons for users to turn off their ad-blockers at least temporarily (in percent)
More Information
Cars
Nov 8, 2017
This chart shows projected global number of passenger cars and related oil demand from 2016 to 2040.
More Information
U.S. Gun Deaths
Nov 8, 2017
This chart shows deaths in U.S. firearm-related incidents compared to total U.S. war deaths.
More Information
Q3 Results
Nov 8, 2017
This chart compares the global average revenue per user for Snap and Facebook before and after their respective IPO's.
More Information
U.S. Presidency
Nov 8, 2017
This chart shows the average share of respondents who approve/disapprove with Trump's performance (in percent)
More Information
U.S. Presidency
Nov 8, 2017
This chart shows views on how selected leadership traits are well suited to describe Donald Trump (in percent)
More Information
Preparedness
Nov 7, 2017
This chart shows the most commonly cited 'zombie plans'.
More Information
Apple
Nov 7, 2017
This chart shows what Apple could buy with its offshore cash.
More Information
Music consumption
Nov 7, 2017
This chart shows how many hours Americans listen to music every week.
More Information
Gun Crime
Nov 7, 2017
This chart shows the number of victims of the worst mass shootings in the United States between 1982 and November 2017
More Information
Premier League
Nov 7, 2017
This chart shows the share of games won by David Moyes, by club.
More Information
Web Access
Nov 7, 2017
This chart shows the number of government internet shutdowns worldwide (Jan 2016 to Sep 2017)
More Information
Semiconductor industry
Nov 6, 2017
This chart ranks the Top 10 semiconductor vendors worldwide based on 2016 market share.
More Information
Donald Trump
Nov 6, 2017
This chart shows the disapproval/approval of U.S. presidents during their first November in office.
More Information
Meal Kit Delivery
Nov 6, 2017
This chart shows the number of cctive customers of meal kit delivery services in the United States.
More Information
Automobiles
Nov 6, 2017
This chart shows the gap between real fuel consumption of passenger cars in Europe and manufacturer's specifications (in %)
More Information
Startups
Nov 6, 2017
This chart shows the most frequently cited reasons for startup failure.
More Information
US Politics
Nov 3, 2017
This chart shows weekly share of US citizens who approve of the way the President is handling his job (Jan to Oct 2017).
More Information
Apple
Nov 3, 2017
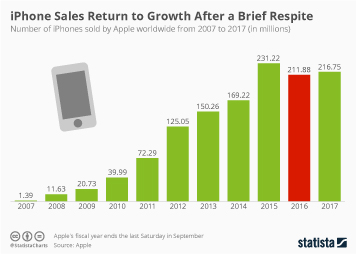
This chart shows iPhones sales since 2007.
More Information
Pumpkins
Nov 3, 2017
This chart shows the annual pumpkin harvest in Germany.
More Information
Ireland
Nov 3, 2017
This chart shows key data on health and wellbeing in Ireland in 2017.
More Information
International Series - Japanese
Nov 3, 2017
Part of Statista's International Series: 衰退するパチンコ業界
More Information
U.S. Politics
Nov 2, 2017
This chart shows the net approval ratings of the most and least popular U.S. Senators in 2017.
More Information
Facebook
Nov 2, 2017
This chart shows a geographical breakdown of Facebook's user base and revenue in Q3 2017.
More Information
Journalism
Nov 1, 2017
This chart shows the share saying "yes", journalists are an enemy of the American people.
More Information
United Kingdom
Nov 1, 2017
This chart shows a selection of potentially big political figures in the United Kingdom.
More Information
Apple iPhone X
Nov 1, 2017
This chart shows how much Apple charges to repair damages to different iPhone models.
More Information
Public Transport
Nov 1, 2017
The World's Top Cities For Sustainable Public Transport
More Information
NAFTA
Nov 1, 2017
This chart shows the U.S. states with the most jobs supported by trade with Canada/Mexico attributable to NAFTA.
More Information
Family
Nov 1, 2017
This charts shows a breakdown of the free-time activities of children in the U.S.
More Information
Major League Baseball
Oct 30, 2017
This chart shows the number of World Series Championships won by team in the history of Major League Baseball.
More Information
Lithium
Oct 27, 2017
This chart shows the countries with the biggest lithium reserves and respective mine production in 2016
More Information
U.S. Politics
Oct 27, 2017
This chart shows the favorability of President Trump among U.S. military personnel/by service in 2017.
More Information
Halloween 2017
Oct 27, 2017
This chart shows American's views on celebrating Halloween 2017.
More Information
Halloween
Oct 27, 2017
This chart shows the frightening figures behind the holiday.
More Information
Passports
Oct 27, 2017
This chart shows the number of visa free countries passport holders can visit in 2017.
More Information
International Series - Mandarin
Oct 27, 2017
Part of Statista's International Series: 中国正在威胁美国”独角兽”公司的优势地位
More Information
Q3 Tech Earnings
Oct 27, 2017
This chart shows the Q3 2017 reported revenue and year over year growth of four key tech companies.
More Information
Syria
Oct 26, 2017
This chart shows the share of people reached by aid in besieged areas of Syria in 2017.
More Information
Social Media
Oct 26, 2017
This chart compares Twitter's long-term user growth to that of the company's competitors.
More Information
JFK
Oct 26, 2017
This chart shows the US public's beliefs about the assassination of President Kennedy.
More Information
United States
Oct 26, 2017
This chart shows the results of a survey into the views of U.S. military personnel on President Trump.
More Information
Smart Locks
Oct 26, 2017
This chart shows the results of a survey into people's acceptance of smart locks such as Amazon Key.
More Information
Global 2000
Oct 26, 2017
This chart shows foreign revenue as a share of total revenue in 2017.
More Information
ISIS
Oct 25, 2017
This chart shows the number of foreign ISIS fighters who have returned from Syria or Iraq.
More Information
China
Oct 25, 2017
This chart shows the key and numbers behind the Communist of China in 2017.
More Information
Halloween
Oct 25, 2017
This chart shows U.S. Halloween spending since 2007
More Information
Terrorism
Oct 25, 2017
This infographic shows the number of foreign children living in the so-called Islamic State, by origin country.
More Information
Tax Havens
Oct 25, 2017
This chart shows Fortune 500 companies by number of tax haven subsidiaries in 2017.
More Information
NFL
Oct 25, 2017
This chart shows the Net favorability of the following brands, by political stance.
More Information
PSD2
Oct 25, 2017
This chart shows the share of the five biggest banks in the banking industry's total assets in 2016, per country.
More Information
North Korea
Oct 24, 2017
This chart shows the share considering the following the greatest immediate threat to the U.S.
More Information
Tax Havens
Oct 24, 2017
This chart shows the Fortune 500 companies with the most money held offshore in 2016.
More Information
Pollution
Oct 24, 2017
This chart shows global estimated deaths by major risk factor and cause in 2015.
More Information
GAFAM
Oct 23, 2017
This chart shows the annual budget and number of meetings with the European Commission since 2014 of GAFAM companies.
More Information
Apple Pay
Oct 23, 2017
This chart shows ther percentage of retailers in North America that accept alternative payment methods such as Apple Pay.
More Information
European Union
Oct 23, 2017
This chart shows the share agreeing their country has benefitted from
More Information
Justice System
Oct 23, 2017
This chart shows the gender of inmates in U.S. federal prisons compared to the general population
More Information
Japan
Oct 23, 2017
Seats won in the Japanese parliamentary election by party as of 6:30am JST.
More Information
Autocracy
Oct 23, 2017
This chart shows responses to "is a system where a strong leader can make decisions without interference good or bad?"
More Information
Global 2000
Oct 20, 2017
This chart shows the Top 10 companies for growth on the Forbes 2017 Global 2000 list.
More Information
Investment
Oct 20, 2017
This chart shows newly issued green bonds and world regions with highest emissions (in billion euros)
More Information
Global 2000
Oct 20, 2017
This chart shows the Top 10 best regarded companies globally on a scale of 0-100 in 2017.
More Information
International Series - Dutch
Oct 20, 2017
Part of Statista's International Series: Waar steun voor de sleepwet het grootst zou kunnen zijn.
More Information
Donald Trump
Oct 19, 2017
This chart shows the share of Britons who would accept/decline an invitation by a world leader in 2017.
More Information
Conflict & Infrastructure
Oct 19, 2017
This chart shows housing units damaged and destroyed in selected Syrian cities 2017
More Information
Child Mortality
Oct 19, 2017
This chart shows the probability of dying between birth and five years of age (per 1,000 live births)
More Information
Immigration
Oct 19, 2017
This chart shows the number of immigrants in the U.S. and share of the population.
More Information
Online Security
Oct 18, 2017
THis chart shows how many Americans use the same password for several online logins.
More Information
U.S. Military
Oct 18, 2017
More Information
Buns & Burgers
Oct 18, 2017
This chart shows foods people from selected European countries want to see more of (in percent)
More Information
Markets
Oct 18, 2017
This infographic shows the S&P 500 Index since March 2009
More Information
Capital Cities
Oct 18, 2017
This chart shows the reduction in GDP per inhabitant if the capital city was removed (2015).
More Information
Democracy
Oct 17, 2017
This chart shows responses to the question: "how satisfied are you with the way democracy is working in your country?"
More Information
Best Employers
Oct 17, 2017
This chart shows the top 10 global employers on a scale of 0-100 in 2017
More Information
121
/
161
Contact
Get in touch with us. We are happy to help.
Do you still have questions?
Feel free to contact us anytime using our
contact form
or visit our
FAQ page
.
Your contact to the Infographics Newsroom
Felix Richter
Data Journalist
felix.richter@statista.com
+49 (40) 284 841 557