Skip to main content
Consumer Goods & FMCG
E-Commerce
Economy & Politics
Energy & Environment
Health, Pharma & Medtech
Internet
Media
Technology & Telecommunications
Transportation & Logistics
Travel, Tourism & Hospitality
View all industries
Global data volume growth
Global AI market size
Number of generative AI users worldwide
Global inflation rate
Retail e-commerce sales worldwide
Largest economies worldwide
Biggest social media platforms by users
Global EV market share by manufacturer
International tourist arrivals by world region
Global annual CO₂ emissions
Browse recent statistics
Artificial intelligence (AI) worldwide
TikTok
Nvidia
E-commerce worldwide
Global GDP
Instagram
Apparel market worldwide
Video gaming worldwide
Global renewable energy industry
Influencer marketing worldwide
Browse recent topics
Consumer Trends 2026
Artificial Intelligence: in-depth market analysis
E-commerce challenges
Global economy
TikTok
Luxury goods: in-depth market analysis
Electric vehicles: A global overview
Video gaming worldwide
Travel and tourism trends 2026
Battery recycling worldwide
Browse recent reports
Explore the tool
Explore Classic mode
Advertising & Media
eCommerce
Consumer
Finance
Global Indicators
Health
Industrial
Mobility
Technology
Explore Market Insights
eCommerce Insights
Research AI
Book a demo
All integrations
Developer docs
Explore Statista Connect
Research
Strategy & Consulting
Marketing
Media & PR
Explore AI assistants
Marketing
Research & Development
Strategy
Sales
Find the fact
Tell the story
Win the pitch
Understand the market
Develop your strategy
Academia
Agencies
Consultancies
Consumer goods
Finance
Tech
Research solutions
Strategy consulting
Communication services
Explore Statista+
Statista R
Statista Healthcare
About Statista
First steps & help center
Webinar & training hub
Success stories
Individuals & Small Teams
Businesses & Enterprises
Academia & Government
English
Deutsch
Daily Data
Global stories vividly visualized
Person-to-Person payment services
Nov 9, 2021
This chart shows the total payment volume processed by Venmo in the U.S.
More Information
U.S. Land Borders
Nov 8, 2021
This chart shows goods and people crossing U.S. land borders per day on average pre-pandemic.
More Information
International travel
Nov 8, 2021
This chart shows the monthly trend in non-U.S. resident visitor arrivals to the United States, by country of residence.
More Information
Sport
Nov 8, 2021
This chart shows the share of UK sports fans that follow US sports in 2021, by league
More Information
U.S. Sports
Nov 5, 2021
This chart shows the share of respondents who said they followed the following U.S. sports leagues (2021).
More Information
Peloton
Nov 5, 2021
This chart shows the average monthly workouts per connected fitness subscription on Peloton.
More Information
Gaming
Nov 5, 2021
This charts shows the video game franchises with the most worldwide unit sales.
More Information
Wealth
Nov 4, 2021
This infographic is a ranking of the people in China with the largest net worth in 2021.
More Information
CO₂ Emissions
Nov 4, 2021
This chart shows the annual change in global energy-related CO₂ emissions as well as the make-up of the emissions reduced in 2021.
More Information
Nintendo Wii vs. Switch
Nov 4, 2021
This chart shows worldwide unit sales of the Nintendo Wii and Switch after their respective launches.
More Information
Nintendo, Microsoft & Sony
Nov 4, 2021
This chart shows the estimated lifetime sales of current-gen consoles by market.
More Information
Climate Change Impacts
Nov 4, 2021
This chart shows the average number of internal climate migrants by 2050 per region.
More Information
Global Economy
Nov 4, 2021
This chart shows the companies with the largest market capitalizations in the world in 2005 and 2021.
More Information
Sponsored Post
Nov 4, 2021
More Information
COVID-19 Vaccination
Nov 3, 2021
This chart shows the share of employed Americans who said their employer encourages/requires vaccination against COVID-19.
More Information
Posthumous Earners
Nov 3, 2021
This chart shows the highest posthumous earners worldwide in 2021 (on million U.S. dollars).
More Information
Environment
Nov 3, 2021
This chart shows the share around the world that say they trust a little/not at all what scientists say about the environment in 2021.
More Information
Climate
Nov 3, 2021
This chart shows the carbon pricing policies in selected countries in EUR per tonne of CO2 in 2021.
More Information
Then & Now
Nov 2, 2021
This chart shows the number of summer days over time in Northern Hemisphere mid-latitudes.
More Information
Politics
Nov 2, 2021
This chart shows President Biden job approval and the share of U.S. adults saying the country is headed in the wrong direction in 2021.
More Information
Climate
Nov 2, 2021
This chart shows the estimated annual CO2 equivalent emissions of selected countries and of tropical deforestation (in Gt/year).
More Information
Deaths from COVID-19
Nov 1, 2021
This chart shows cumulative confirmed coronavirus deaths, by world region (as of Oct 31, 2021).
More Information
Borders
Oct 29, 2021
This chart shows European nations which have human-made barriers along the entirety or parts of their borders (2021).
More Information
Environment
Oct 29, 2021
This infographic compares the price per megawatt hour of electricity, by source.
More Information
Logistics
Oct 29, 2021
This chart shows the share of online purchasers saying they would prefer to use the following delivery methods in the future.
More Information
Trade
Oct 29, 2021
This chart compares the sizes of the EEZ surface are in European waters and fishing volumes.
More Information
XR Market
Oct 29, 2021
This chart shows the estimated share of XR device shipments by vendor worldwide in Q1 of 2020 and Q1 of 2021.
More Information
Real Estate
Oct 29, 2021
This chart shows the average years a skilled employee needs to work to afford a 60m2 apartment near the city center.
More Information
Facebook
Oct 29, 2021
This chart shows monthly active users of services owned by Facebook.
More Information
Society
Oct 29, 2021
This chart shows daylight times in London before and after the clocks go back on 31 October 2021.
More Information
InFact
Oct 29, 2021
This chart shows the countries that don't legally sell Coca-Cola.
More Information
Fear
Oct 28, 2021
This chart shows the fears most commonly cited by Americans (saying they made them "afraid" or "very afraid").
More Information
Payment Service Usage
Oct 28, 2021
This chart shows the "buy now, pay later" prevalence in select countries.
More Information
Economy
Oct 27, 2021
This chart shows the UK general government gross debt as a share of GDP since 1980/81.
More Information
Afghanistan
Oct 27, 2021
This chart shows the share of the Afghan population experiencing food insecurity (in percent) between 2020 and 2021.
More Information
Journalism Market
Oct 27, 2021
This chart shows the favored platforms for local topics according to Reuters Institute.
More Information
Most valuable public companies
Oct 27, 2021
This chart shows the highest valuated companies by current market cap.
More Information
Society
Oct 26, 2021
This chart compares the most popular baby names given in England and Wales in 1996 and 2020.
More Information
COVID-19 Vaccines
Oct 26, 2021
This chart shows the share of global COVID-19 vaccine doses given out by country/continent and those countries'/continents' share of...
More Information
Social Media
Oct 26, 2021
This chart shows the share of U.S. adults that regularly use Facebook and Instagram, by age group in 2021.
More Information
Shipping
Oct 25, 2021
This chart shows the end-to-end transit time for China-U.S. ocean freight (in days).
More Information
Democratic Party
Oct 25, 2021
This chart shows the share of self-identifying U.S. Democrats who describe their political ideology as liberal, moderate or conservative...
More Information
Laptops
Oct 22, 2021
This chart shows the share of U.S. laptop owners who own a device from the following brands.
More Information
E-Mobility
Oct 22, 2021
This chart shows the year-to-date market share of cars registered in the EU by fuel type.
More Information
10 Years Arab Spring
Oct 22, 2021
This chart shows selected countries in the Arab World by their 2020 Economist Intelligence Unit Democracy Index score and change in...
More Information
Mobility Worldwide
Oct 22, 2021
This chart shows the revenue of short-term shared mobility services worldwide.
More Information
InFact
Oct 22, 2021
This chart shows the distribution of biomass on earth by group of organism
More Information
Billionaires
Oct 21, 2021
This chart shows the billionaires who could most quickly achieve a net worth of more than $100 billion based on their 2021 wealth gains...
More Information
COVID-19 Lockdowns
Oct 21, 2021
This chart shows the areas with the longest cumulative pandemic lockdowns.
More Information
Telecommunication Infrastructure
Oct 20, 2021
This chart shows the top 8 telecom infrastructure companies by brand value.
More Information
Society
Oct 19, 2021
This chart shows global public net level of trust in certain groups of people in 2021.
More Information
Tech
Oct 19, 2021
This chart shows the extent to which drone flight is regulated, by country.
More Information
Then & Now
Oct 19, 2021
This chart shows the time it took for the telephone and the mobile phone to reach 50 million users.
More Information
Art Auctions
Oct 19, 2021
This chart shows the most expensive Banksy artworks sold at auction.
More Information
United Kingdom
Oct 18, 2021
This chart shows the most commonly given names to babies born in 2020 in England and Wales.
More Information
Consumer Markets
Oct 18, 2021
This chart shows the fastest-growing consumer markets in the world by growth of the consumer class between 2020 and 2030.
More Information
Tech
Oct 18, 2021
This chart shows the results of a poll into the most anticipated products for the Apple launch event in October 2021.
More Information
Smartwatch market
Oct 15, 2021
This chart shows the share of smartwatch or fitness tracker users in the U.S. who own a model by the following brands and overall smartwatch...
More Information
Mobile Broadband Technology
Oct 15, 2021
This chart shows the eight countries with the best 5G and 4G availability in percentage of time users are connected.
More Information
Social Media
Oct 15, 2021
This chart shows the countries where LinkedIn has the largest audience reach as of July 2021.
More Information
Space Travel
Oct 15, 2021
This chart shows the age of the oldest astronauts when they were launched into space.
More Information
InFact
Oct 15, 2021
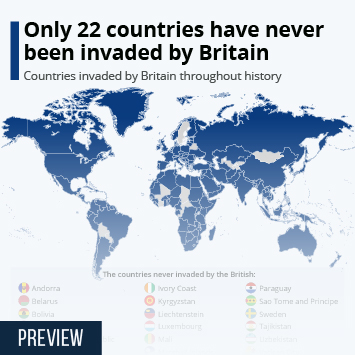
This chart shows all the countries invaded by Britain throughout history.
More Information
Society
Oct 14, 2021
This chart shows the total fertility rate of women in England and Wales from 1938 to 2020.
More Information
Social Media
Oct 14, 2021
This chart shows the time it took for selected social media services to reach one billion monthly active users (in years).
More Information
Sponsored Post
Oct 14, 2021
More Information
Sponsored Post
Oct 14, 2021
More Information
Aviation Industry
Oct 14, 2021
This chart shows the income and revenue of Delta Airlines by quarter.
More Information
Robotaxis
Oct 14, 2021
This chart shows the percent of shared mobility passenger kilometers traveled in China's tier one cities, by type of service.
More Information
Forbes Best Employers
Oct 13, 2021
This chart shows the top 8 companies in the Forbes World's Best Employers Ranking in 2017, 2019 and 2021, by sector.
More Information
Video Streaming
Oct 13, 2021
This chart shows the most watched Netflix shows in first 28 days since release.
More Information
Trade
Oct 13, 2021
This chart shows the share of GB adults that reported experiencing difficulties buying certain goods in the UK in autumn 2021.
More Information
Culture & Community
Oct 12, 2021
This chart shows the top 10 neighborhoods ranked by food, culture and community.
More Information
Then & Now
Oct 12, 2021
This charts shows the share of female Nobel Prize winners.
More Information
Opinions on the European Union
Oct 12, 2021
This chart shows the percentage of respondents with favorable views of the EU by member countries.
More Information
Indigenous People
Oct 11, 2021
This chart shows countries on the American continent by the size of their indigenous populations.
More Information
Health
Oct 11, 2021
This chart gives a breakdown of the people reporting Long Covid symptoms in the UK in 2021.
More Information
Nobel Prize
Oct 11, 2021
This chart shows the number of female Nobel Prize Laureates (1901-2021).
More Information
Digital Advertising
Oct 8, 2021
This chart shows the advertisement awareness on social media platforms.
More Information
Trust in Social Media
Oct 8, 2021
This chart shows the top reasons not to use Facebook for U.S. residents.
More Information
Coronavirus & Air Travel
Oct 8, 2021
This chart shows the COVID-19 relief for airlines by region.
More Information
Climate Change
Oct 7, 2021
This chart shows the size of the largest coral reef areas by region.
More Information
Misconduct Investigations
Oct 7, 2021
This chart shows the share of companies where illegal and unethical behavior occurred/which lost more than €100,000 because of it in...
More Information
Nobel Prize in Literature
Oct 7, 2021
The chart shows the number of Literature Nobel Prize awarded by country.
More Information
Coal
Oct 6, 2021
This chart shows the countries generating the biggest shares of their electricity from coal, in percent (2020 or latest available).
More Information
Coal Shortage
Oct 6, 2021
Number of days for which coal reserves exist at Indian power plants registered with the Central Electricity Authority (as of Oct 4,...
More Information
Prescription Drug Revenue
Oct 6, 2021
This chart shows the sales revenue of best selling prescription drugs by illness.
More Information
Tech
Oct 5, 2021
This chart shows the support timeframe of all Windows versions since 2001.
More Information
Global social media users
Oct 5, 2021
This chart shows Facebook's active monthly user share of the world population.
More Information
Pandora Papers
Oct 4, 2021
This chart shows the countries with the most politicians included in the Pandora Papers release.
More Information
Pandora Papers
Oct 4, 2021
This chart shows the size of selected major data leaks.
More Information
60
/
161
Contact
Get in touch with us. We are happy to help.
Do you still have questions?
Feel free to contact us anytime using our
contact form
or visit our
FAQ page
.
Your contact to the Infographics Newsroom
Felix Richter
Data Journalist
felix.richter@statista.com
+49 (40) 284 841 557