Skip to main content
Consumer Goods & FMCG
E-Commerce
Economy & Politics
Energy & Environment
Health, Pharma & Medtech
Internet
Media
Technology & Telecommunications
Transportation & Logistics
Travel, Tourism & Hospitality
View all industries
Global data volume growth
Global AI market size
Number of generative AI users worldwide
Global inflation rate
Retail e-commerce sales worldwide
Largest economies worldwide
Biggest social media platforms by users
Global EV market share by manufacturer
International tourist arrivals by world region
Global annual CO₂ emissions
Browse recent statistics
Artificial intelligence (AI) worldwide
TikTok
Nvidia
E-commerce worldwide
Global GDP
Instagram
Apparel market worldwide
Video gaming worldwide
Global renewable energy industry
Influencer marketing worldwide
Browse recent topics
Consumer Trends 2026
Artificial Intelligence: in-depth market analysis
E-commerce challenges
Global economy
TikTok
Luxury goods: in-depth market analysis
Electric vehicles: A global overview
Video gaming worldwide
Travel and tourism trends 2026
Battery recycling worldwide
Browse recent reports
Explore the tool
Explore Classic mode
Advertising & Media
eCommerce
Consumer
Finance
Global Indicators
Health
Industrial
Mobility
Technology
Explore Market Insights
eCommerce Insights
Research AI
Book a demo
All integrations
Developer docs
Explore Statista Connect
Research
Strategy & Consulting
Marketing
Media & PR
Explore AI assistants
Marketing
Research & Development
Strategy
Sales
Find the fact
Tell the story
Win the pitch
Understand the market
Develop your strategy
Academia
Agencies
Consultancies
Consumer goods
Finance
Tech
Research solutions
Strategy consulting
Communication services
Explore Statista+
Statista R
Statista Healthcare
About Statista
First steps & help center
Webinar & training hub
Success stories
Individuals & Small Teams
Businesses & Enterprises
Academia & Government
English
Deutsch
Daily Data
Global stories vividly visualized
OPEC
Oct 1, 2021
This chart shows the revenue generated by petroleum and other exports in OPEC countries from 1960 until 2020.
More Information
Statista Global Consumer Survey
Oct 1, 2021
This chart shows the drinks that the most people in the UK drink regularly in 2021.
More Information
Worldwide Crop Production
Oct 1, 2021
This chart shows the share of global crop production by farm size.
More Information
Health Conditions in the EU
Oct 1, 2021
This chart shows the countries with the highest and lowest share of people with high blood pressure in the EU.
More Information
Tech
Sep 30, 2021
This chart shows the ways in which people use cloud storage services in 2021.
More Information
Streaming
Sep 30, 2021
This chart shows Netflix user responses to the question: "Which types of films or shows do you watch as online content?"
More Information
UK
Sep 30, 2021
This chart shows the share of GB adults that think Brexit is going well or badly in 2021.
More Information
E-Cigarettes and Vapes
Sep 30, 2021
This chart shows a breakdown of where e-cigarettes are banned and restricted.
More Information
H&M Group Sales
Sep 30, 2021
This chart shows the H&M Group top markets by sales in the first three quarters of 2021.
More Information
Mobile Data Usage
Sep 30, 2021
This chart shows the countries with highest percentage of users with unlimited mobile data plans.
More Information
Economy
Sep 30, 2021
This chart shows the UK quarterly real GDP index from Q1 2008 to Q2 2021.
More Information
Brand Value
Sep 29, 2021
This chart shows the brand value of the most valuable brands in the United Kingdom in 2021.
More Information
eSports
Sep 29, 2021
This chart shows the highest earning eSports countries by prize money in 2020.
More Information
Climate Change
Sep 29, 2021
This chart shows the change in the frequency of climate disasters experienced in a lifetime for a person born in 2020 compared to one...
More Information
Netflix Originals
Sep 29, 2021
This chart shows the share of Netflix Originals and Exclusives released worldwide by country of origin.
More Information
Real-Time Payments
Sep 28, 2021
This chart shows the transaction value of real-time payments in 2020, by country (in billion U.S. dollars).
More Information
Social Media Usage
Sep 28, 2021
This chart shows the percentage of TikTok users in the last 12 months by country.
More Information
Politics
Sep 27, 2021
Share of SPD voters who voted for the party mainly due to its chancellor candidate
More Information
Wealth
Sep 27, 2021
This chart shows the richest families in the world as of 2021.
More Information
Europe
Sep 27, 2021
This chart shows the share of the vote received in German federal elections since 1990, by party.
More Information
Health
Sep 24, 2021
This chart shows alcohol-specific death rates per 100,000 people in the UK in 2001 and 2019, by age group. alcoholic liver disease
More Information
Economy
Sep 24, 2021
This chart shows the estimated number of large goods vehicle drivers in the UK.
More Information
Abortion
Sep 24, 2021
This chart shows the change in the share of people supporting abortion in selected countries between 2014 and 2021.
More Information
Podcast Listening Habits
Sep 24, 2021
This chart shows the percentage of podcast listeners around the world.
More Information
Logistics
Sep 24, 2021
This chart shows the current market capitalization of the biggest courier companies.
More Information
Armed Forces
Sep 23, 2021
This chart shows the share of active duty military personnel which is female in selected countries in 2019 (in percent).
More Information
Country reputations in the public eye
Sep 23, 2021
This chart shows the countries with most respondents with favorable views towards the U.S. or China.
More Information
The Pokémon Company
Sep 23, 2021
This chart shows the net income of the Pokémon Company by fiscal year.
More Information
News on social media
Sep 23, 2021
This chart shows the most popular social media sites for news.
More Information
Energy
Sep 22, 2021
Chinese public investment in foreign coal power as of September 2021, by recipient country.
More Information
Record Companies
Sep 22, 2021
This chart shows the global digital and physical revenue market share of largest record companies.
More Information
Technology
Sep 21, 2021
This chart shows the forecast reach of digital audio and traditional radio advertising in the United States.
More Information
Politics
Sep 21, 2021
This chart compares the results of the Canadian federal elections in 2019 and 2021.
More Information
Submarine warfare
Sep 21, 2021
This chart shows the number of military submarines in service by country.
More Information
Cost for Netflix subscriptions
Sep 21, 2021
This chart shows the top 8 countries with the cheapest Netflix standard plans.
More Information
Society
Sep 20, 2021
This chart shows conceptions per 1,000 women aged 15-17 in England & Wales in 2020, by region.
More Information
Open Source Software
Sep 17, 2021
The chart shows the active GitHub contributors by employer.
More Information
Gubernatorial politics in the U.S.
Sep 16, 2021
This chart shows the outcomes of recall elections of incumbent governors in U.S. history.
More Information
Education
Sep 16, 2021
This chart shows the annual hours of net teaching time in selected countries in 2021 (or latest available).
More Information
Society
Sep 16, 2021
This chart shows the education spending as a share of gross domestic product in selected countries in 2018.
More Information
Minimum wage & the poverty line
Sep 16, 2021
The chart shows the working hours needed at minimum wage to escape poverty in select OECD countries.
More Information
Chuseok Fall Festival
Sep 16, 2021
This chart shows answers among South Korean office workers about plans for the Chuseok fall festival (2021).
More Information
Gross Domestic Product
Sep 15, 2021
The chart shows the highest GDP per capita worldwide.
More Information
Foreign Direct Investment
Sep 14, 2021
This chart shows FDI inflow and contribution of capital inflows to capital formation in India (in billion U.S. dollars).
More Information
Tech
Sep 14, 2021
This chart shows the results of a poll into the most anticipated products for the Apple launch event in September 2021.
More Information
Communicable diseases
Sep 14, 2021
The chart shows tuberculosis treatments and HIV tests in millions in countries supported by the Global Fund.
More Information
Health
Sep 13, 2021
This chart shows Covid-19 related deaths in England in 2021 by vaccination status.
More Information
China Housing Market
Sep 13, 2021
This chart shows the monthly year-over-year price increase for new residential buildings in China, by city tier (in percent).
More Information
GDP in Europe
Sep 10, 2021
This chart shows the European countries and regions with the lowest GDPs in 2019.
More Information
Economy
Sep 10, 2021
This chart shows the UK GDP monthly index from 2007 to 2021.
More Information
War on Terror
Sep 10, 2021
This chart shows civilians killed in U.S. airstrikes in Afghanistan, Iraq and Syria since 9/11/2001.
More Information
Mental Health
Sep 9, 2021
This chart shows the number of suicides per 100,000 population in 2020 in England and Wales, by region.
More Information
Food
Sep 9, 2021
This chart shows a forecast for the market value of edible insects worldwide to 2023.
More Information
Paralympic Games
Sep 9, 2021
This chart shows the medal count for Paralympic Games 2021.
More Information
Work in India
Sep 8, 2021
This chart shows average annual salary increases in India (in percent).
More Information
Global Consumer Survey
Sep 8, 2021
This chart shows U.S. adult responses to the question "How do you usually find out about new interesting products?" in 2021.
More Information
Celebrity
Sep 8, 2021
This chart shows the relative Google Search interest in the United States for 'Free Britney' in 2021.
More Information
Book Market Worldwide
Sep 8, 2021
This chart shows the revenue of the largest book publishers worldwide.
More Information
Society
Sep 7, 2021
This chart shows the share of GB adults who felt “very or fairly unsafe” walking alone, by setting and gender in 2021.
More Information
Mobile Payment
Sep 7, 2021
This chart shows mobile money accounts by region in 2020.
More Information
Bitcoin ATMs worldwide
Sep 7, 2021
The chart shows the number of Bitcoin ATMs by region worldwide.
More Information
Economy
Sep 6, 2021
This infographic charts the material prices index for all construction work in the UK from January 2016 to July 2021.
More Information
Health
Sep 6, 2021
This chart shows the number of World Trade Center-related FDNY deaths by year.
More Information
Social Benefits
Sep 3, 2021
This chart shows the share of selected population groups covered by social protection benefits, by region (2020 or latest available,...
More Information
COVID-19
Sep 3, 2021
This chart shows deaths attributed to COVID-19 by U.S. state in the past 28 days (as of Sep 3, 2021).
More Information
Jobs Crisis
Sep 3, 2021
This chart shows the number of persons claiming unemployment benefits in the U.S. through all programs in the week ended August 14,...
More Information
Precipitation Records
Sep 3, 2021
This chart shows the maximum hourly precipitation events in New York City from 1943 to 2021 (as of September 9, 2021).
More Information
Weather Damage
Sep 2, 2021
This chart shows the global economic losses (in billion U.S. dollars) for weather-related disasters from 2001 to 2020.
More Information
GDP Growth
Sep 1, 2021
This chart shows India's quarterly GDP growth (year-over-year) since 2012.
More Information
Collaboration software
Sep 1, 2021
The chart shows the market share of companies in the collaboration software segment worldwide.
More Information
Sport
Aug 31, 2021
This chart shows the football merchandise most and least commonly owned by UK football fans in 2021.
More Information
Housing
Aug 31, 2021
This chart shows the share of the population living in an overcrowded household in selected European countries.
More Information
EU Travel Zone
Aug 31, 2021
This chart shows countries from where it is allowed to enter the EU and Schengen areas amid the COVID-19 pandemic (as of August 31,...
More Information
Video game usage worldwide
Aug 31, 2021
The chart shows the time residents of selected countries spend playing video games per week.
More Information
COVID-19 Pandemic
Aug 31, 2021
This chart shows average daily COVID-19 cases in U.S. states per 100,000 inhabitants.
More Information
Hate Crimes
Aug 31, 2021
This chart shows the total number of hate crime incidents recorded by the FBI.
More Information
COVID-19 Vaccinations
Aug 30, 2021
This chart shows the share of forecast global GDP losses 2022-25 from vaccine delays by world region and development status (in percent).
More Information
COVID-19 Vaccination
Aug 30, 2021
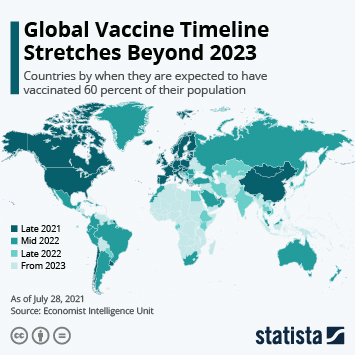
This world map shows countries by when they are expected to have vaccinated 60 percent of their population against COVID-19 (as of...
More Information
Global Consumer Survey
Aug 30, 2021
This chart shows the share of UK adults that have experienced physical pain in the last 12 months, by type in 2021.
More Information
Afghanistan
Aug 30, 2021
This chart shows the governments that have pledged to facilitate the free travel of designated Afghans as of August 29, 2021.
More Information
Politics
Aug 27, 2021
This chart shows the results of a survey into favourability in the UK of major world leaders in 2021.
More Information
App Store
Aug 27, 2021
This chart shows the commission rates charged by Apple from app developers on the App Store.
More Information
Statista Survey
Aug 27, 2021
This chart shows the share of UK respondents who have experienced certain mental health issues in the past 12 months.
More Information
Franchises
Aug 27, 2021
This chart shows the francise fee and total estimated cost of opening a Subway restaurant in selected countries (2021).
More Information
App Stores
Aug 27, 2021
This chart shows estimated consumer spending on Apple's App Store and Google Play.
More Information
COVID-19 Rental Assistance
Aug 27, 2021
This chart shows cumulative expenditures from the Emergency Rental Assistance Program and total program funding (2021).
More Information
Ad Spending
Aug 26, 2021
This chart shows the estimated and projected spend on different types of advertising in the U.S. (in billion U.S. dollars).
More Information
Auto industry
Aug 26, 2021
This chart shows the number of cars manufactured in the UK in July of each year from 2011 to 2021.
More Information
eSports viewership
Aug 26, 2021
This chart shows in which European markets viewership of eSports has increased.
More Information
Pets
Aug 26, 2021
This chart shows the approximate number of households owning different types of pets in the United States (2017-2018).
More Information
61
/
161
Contact
Get in touch with us. We are happy to help.
Do you still have questions?
Feel free to contact us anytime using our
contact form
or visit our
FAQ page
.
Your contact to the Infographics Newsroom
Felix Richter
Data Journalist
felix.richter@statista.com
+49 (40) 284 841 557