Skip to main content
Consumer Goods & FMCG
E-Commerce
Economy & Politics
Energy & Environment
Health, Pharma & Medtech
Internet
Media
Technology & Telecommunications
Transportation & Logistics
Travel, Tourism & Hospitality
View all industries
Global data volume growth
Global AI market size
Number of generative AI users worldwide
Global inflation rate
Retail e-commerce sales worldwide
Largest economies worldwide
Biggest social media platforms by users
Global EV market share by manufacturer
International tourist arrivals by world region
Global annual CO₂ emissions
Browse recent statistics
Artificial intelligence (AI) worldwide
TikTok
Nvidia
E-commerce worldwide
Global GDP
Instagram
Apparel market worldwide
Video gaming worldwide
Global renewable energy industry
Influencer marketing worldwide
Browse recent topics
Consumer Trends 2026
Artificial Intelligence: in-depth market analysis
E-commerce challenges
Global economy
TikTok
Luxury goods: in-depth market analysis
Electric vehicles: A global overview
Video gaming worldwide
Travel and tourism trends 2026
Battery recycling worldwide
Browse recent reports
Explore the tool
Explore Classic mode
Advertising & Media
eCommerce
Consumer
Finance
Global Indicators
Health
Industrial
Mobility
Technology
Explore Market Insights
eCommerce Insights
Research AI
Book a demo
All integrations
Developer docs
Explore Statista Connect
Research
Strategy & Consulting
Marketing
Media & PR
Explore AI assistants
Marketing
Research & Development
Strategy
Sales
Find the fact
Tell the story
Win the pitch
Understand the market
Develop your strategy
Academia
Agencies
Consultancies
Consumer goods
Finance
Tech
Research solutions
Strategy consulting
Communication services
Explore Statista+
Statista R
Statista Healthcare
About Statista
First steps & help center
Webinar & training hub
Success stories
Individuals & Small Teams
Businesses & Enterprises
Academia & Government
English
Deutsch
Daily Data
Global stories vividly visualized
Sockets
Oct 13, 2020
This chart shows the most commonly used electrical outlets worldwide in 2020
More Information
U.S. Politics
Oct 13, 2020
This chart shows the share of U.S. registered voters who consider the following...
More Information
2020 Election
Oct 13, 2020
This chart shows the share of the public who want Biden/Trump to win the U.S. presidential election.
More Information
NBA
Oct 12, 2020
This chart shows the NBA players with the highest number of Finals MVPs won.
More Information
North Korea
Oct 12, 2020
This chart shows the type, class and range of known North Korean ballistic missiles in 2019.
More Information
eHealth
Oct 9, 2020
This chart shows the share of respondents in selected countries using paid/free health apps (2020).
More Information
2020 Election
Oct 8, 2020
This chart shows the percentage of U.S. voters who said they expect voting to be difficult for each upcoming election.
More Information
Halloween
Oct 8, 2020
This chart shows the percentage of U.S. adults who plan to wear Halloween costumes this year compared to those who dressed up last...
More Information
Unemployment
Oct 8, 2020
This chart shows the monthly net store openings in the U.S. in 2020.
More Information
Unemployment
Oct 8, 2020
This chart shows the number of new eating and drinking jobs created in the U.S. relative to the previous month in 2020.
More Information
COVID-19
Oct 8, 2020
This chart shows the countries and regional economies with the biggest billionaire wealth in 2019 and 2020 (in trillion U.S. dollars).
More Information
Nobel Prize
Oct 8, 2020
This chart shows Nobel Prizes awarded in the sciences since 1969 by country and share of immigrant researchers.
More Information
Occupational Safety
Oct 8, 2020
This chart shows the share of workers who say they have been seriously injured on the job as of 2020.
More Information
Politics
Oct 8, 2020
This infographic charts the popularity of German Chancellor Merkel over her 15 years in power.
More Information
2020 Election
Oct 8, 2020
This chart shows who U.S. voters think performed the best in the 2020 vice-presidential debate.
More Information
2020 Election
Oct 8, 2020
This chart shows minutes spoken in the October 07, 2020 televised vice presidential debate.
More Information
Unemployment
Oct 7, 2020
This chart shows the monthly change in new payroll employment in 2020.
More Information
World Migratory Bird Day
Oct 7, 2020
This chart shows the longest annual migration distances recorded for bird species.
More Information
Flu Season
Oct 7, 2020
This chart shows the estimated number of deaths due to influenza in the U.S. by season.
More Information
2020 Election
Oct 7, 2020
This chart shows the percentage of U.S. adults who want either the same party or different parties controlling the presidency and Congress.
More Information
Coronavirus
Oct 6, 2020
This chart shows the share of U.S. adults that say they are scared to some degree of contracting Covid-19.
More Information
Covid-19 Outbreak
Oct 6, 2020
This chart shows the rate of Covid-19 cases per 100,000 residents in U.S. states.
More Information
2020 Election
Oct 6, 2020
This chart shows U.S. public opinion on the likelihood of a peaceful power transition if Joe Biden is elected.
More Information
Socialism
Oct 6, 2020
This chart shows the share saying the following are either 'completely socialist' or 'more socialist than capitalist'.
More Information
Unemployment
Oct 5, 2020
This chart shows the number of U.S. workers who are on or are waiting for unemployment benefits.
More Information
2020 Election
Oct 5, 2020
This chart shows the percentage of U.S. voters from each party who said each issue is important for their vote.
More Information
Alexei Navalny
Oct 5, 2020
This chart shows attitudes among the Russian public to Navalny's poisoning.
More Information
Covid-19 Outbreak
Oct 5, 2020
This chart shows the share of Covid-19 misinformation in the media identified as the following conspiracy theories.
More Information
Teacher Salaries
Oct 5, 2020
This chart shows salary levels for elementaty/primary school teachers.
More Information
Cycling
Oct 2, 2020
This chart shows extra kilometers of cycling measures announced/implemented in the EU during the pandemic.
More Information
Palm Oil
Oct 2, 2020
This chart shows the amount of palm oil produced in selected countries in 2019 (in million metric tons).
More Information
Climate Tech
Oct 2, 2020
This chart shows the ten largest climate tech hubs based on vc capital raised by startups headquartered there between 2013-2019.
More Information
German Reunification
Oct 2, 2020
This chart shows differences in selected economic indicators between Western and Eastern Germany.
More Information
Cycling
Oct 2, 2020
This chart shows additional funding allocated for cycling during the pandemic.
More Information
Fossil Fuels
Oct 2, 2020
This chart shows the percent change in emissions from each European industry between 2013-2019.
More Information
Consumer Market Outlook
Oct 1, 2020
This chart shows per capita consumption of coffee around the world in 2020.
More Information
Migrants
Oct 1, 2020
This chart shows the top and bottom scoring countries in Gallup's Migrant Acceptance Index (top possible score is 9.0).
More Information
World Affairs
Sep 30, 2020
This chart shows which countries/states are neither signatories nor parties to the 1948 Genocide Convention as of July 2019.
More Information
2020 Election
Sep 30, 2020
This chart shows minutes spoken in the September 29, 2020 televised presidential debate.
More Information
2020 Election
Sep 30, 2020
This chart shows the share of debate watchers who think Trump/Biden won.
More Information
Minority executives
Sep 30, 2020
This chart shows the percentage of minorities who are CEOs of Fortune 500 companies from 2000-2020.
More Information
Halloween
Sep 29, 2020
This chart shows the percentage of U.S. adults who plan to allow their children to trick-or-treat this Halloween.
More Information
Politics
Sep 29, 2020
This chart shows the percentage of Americans who say social media companies should allow political ads on their platforms.
More Information
Nagorno Karabakh
Sep 29, 2020
This chart shows the estimated military equipment/personnel of Armenia/Azerbaijan in 2020.
More Information
Trade Shows
Sep 29, 2020
This chart shows revenue from business spending on trade show exhibitions in the United States.
More Information
Trump Taxes
Sep 29, 2020
This chart shows federal income tax payments by presidents in the first year of their administration.
More Information
Coffee
Sep 29, 2020
This chart shows the average price for a cappuccino in different cities in 2019.
More Information
Clean energy
Sep 28, 2020
This chart shows the projected percent share of non-fossil fuels in China's total energy consumption between 2019-2060.
More Information
Celebrities
Sep 28, 2020
This chart shows the list of the top five most admired men and women across the world in 2020.
More Information
Crime
Sep 28, 2020
This chart shows the estimated aggregate earnings lost annually in the U.S. due to convictions and imprisonment.
More Information
Pharma Industry
Sep 28, 2020
This chart shows the 2019 and five-year average annual earnings growth of Celltrion, the pharma industry and stock market.
More Information
Teacher wages
Sep 28, 2020
This chart shows the percent difference in weekly wages for K-12 public school teachers compared to nonteaching, college-educated peers.
More Information
COVID-19
Sep 25, 2020
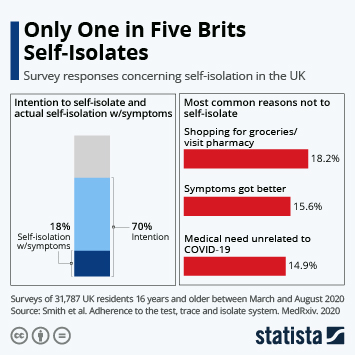
This chart shows the number of Brits intending to self-isolate when experiencing COVID-19 like symptoms and the number of Brits actually...
More Information
Chuseok Fall Festival
Sep 25, 2020
This chart shows the share of Korean office workers who said they would not visit their hometowns for the Chuseok fall festival (2016-2021).
More Information
United Kingdom
Sep 25, 2020
This chart shows the people most admired by Britons in 2020.
More Information
2020 Presidential Election
Sep 25, 2020
This chart shows the emotional response evoked by possible outcomes of the 2020 election.
More Information
Federal Law Enforcement
Sep 24, 2020
This chart shows which branch of the U.S. government has the power over federal law agencies and some other entities
More Information
Automobile Industry
Sep 24, 2020
This chart shows the largest markets in terms of new passenger car/light vehicle registrations in 2019.
More Information
Wage Gap
Sep 24, 2020
This chart shows the estimated cumulative gain in real GDP if the following wage gaps had been closed 20 years ago.
More Information
2020 Election
Sep 23, 2020
This chart shows the percentage of U.S. voters who are very closely following national politics, by presidential election year.
More Information
Clean energy
Sep 23, 2020
This chart shows the projected percent composition of passenger vehicles in China over the next two decades.
More Information
Supreme Court Controversy
Sep 23, 2020
This chart shows the share of U.S. adults agreeing the election winner should appoint Ginsberg's Supreme Court replacement.
More Information
Agriculture
Sep 23, 2020
This chart shows China's projected share of the global production of selected crops in the 2020/21 season.
More Information
Streaming
Sep 23, 2020
This chart shows the market share of streaming (OTT) platforms in India in Q2 2020.
More Information
Digital Markets
Sep 22, 2020
Online vs. offline population in China and India compared to the United States in 2020.
More Information
COVID-19
Sep 22, 2020
This chart shows the projected increase of business insolvencies in 2021 compared with 2019 (in percent).
More Information
United States Postal Service
Sep 22, 2020
This chart shows the share of first class mail delivered on time in the U.S. by month
More Information
Narcotics
Sep 22, 2020
This chart shows the number of drug-induced deaths per million population in selected European countries.
More Information
Ecological Threats
Sep 22, 2020
This chart shows the number of ecological threats faced by countries in 2020.
More Information
Covid-19 Outbreak
Sep 22, 2020
This chart shows countries with country-wide or localized school closures (as of Sept 21, 2020).
More Information
Microsoft
Sep 22, 2020
This chart shows a list of Microsoft's largest acquisitions to date.
More Information
Supreme Court
Sep 21, 2020
This chart shows the percentage of U.S. voters who think Donald Trump should appoint a new Supreme Court justice before Jan. 2021.
More Information
Student loans
Sep 21, 2020
This chart shows the percent change in total household debt balance since 2003, adjusted for inflation.
More Information
Climate change
Sep 21, 2020
This chart shows the amount of greenhouse gases produced by China and the U.S./Europe (in billion tons).
More Information
COVID-19 Outbreak
Sep 21, 2020
This chart shows total federal spending on major Covid-19 programs by state.
More Information
Emmy Awards
Sep 21, 2020
This chart shows the number of Emmy Awards won by HBO and Netflix since 2013.
More Information
Internet Activity
Sep 21, 2020
This chart shows the estimated data created on the internet in one minute in 2020.
More Information
2020 Election
Sep 18, 2020
This chart shows the percentage of U.S. adults who believe the presidential election will be decided within each timeframe.
More Information
2020 Election
Sep 18, 2020
This chart shows the percentage of U.S. adults who say it's likely/not likely there will be mass protests if Donald Trump is reelected.
More Information
Brand Ranking
Sep 18, 2020
This chart shows the most valuable brands in India in 2020.
More Information
TV vs. Streaming
Sep 18, 2020
This chart shows the estimated revenue change of TV & video products in 2020 compared to 2019 (in percent).
More Information
Covid-19 Outbreak
Sep 18, 2020
This chart shows responses to the question: "What is the best way for states to deal with the coronavirus moving forward?"
More Information
2020 Election
Sep 18, 2020
This chart shows the political action committees spending the highest amount of money on the 2020 election (as of Sept 17, 2020).
More Information
Health
Sep 18, 2020
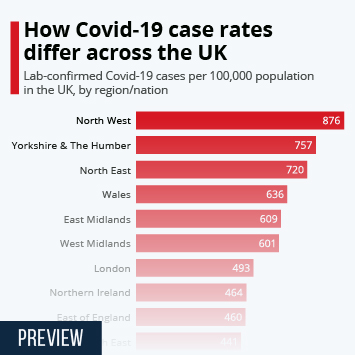
This chart shows the rate of Covid-19 cases per 100,000 population in UK regions and nations.
More Information
Plastic Pollution
Sep 18, 2020
This chart shows metric tonnes of plastic packaging produced annually.
More Information
Holocaust Awarness
Sep 18, 2020
This chart shows the share of Americans aged 18-39 unaware six million Jews died in the Holocaust.
More Information
Gaming Consoles
Sep 17, 2020
This chart shows the historical U.S. launch prices of Playstation and Xbox consoles.
More Information
Economy
Sep 16, 2020
This chart shows the percentage of U.S. voters who say the economy is either recovering, worsening or not changing.
More Information
Media bias
Sep 16, 2020
This chart shows the percentage of people who say bias in media toward others or themselves concerns them more.
More Information
Japanese Diet
Sep 16, 2020
This chart shows the share of votes by party in the upper and lower house of the Japanese Diet after the opposition party merger of...
More Information
73
/
161
Contact
Get in touch with us. We are happy to help.
Do you still have questions?
Feel free to contact us anytime using our
contact form
or visit our
FAQ page
.
Your contact to the Infographics Newsroom
Felix Richter
Data Journalist
felix.richter@statista.com
+49 (40) 284 841 557