Skip to main content
Consumer Goods & FMCG
E-Commerce
Economy & Politics
Energy & Environment
Health, Pharma & Medtech
Internet
Media
Technology & Telecommunications
Transportation & Logistics
Travel, Tourism & Hospitality
View all industries
Global data volume growth
Global AI market size
Number of generative AI users worldwide
Global inflation rate
Retail e-commerce sales worldwide
Largest economies worldwide
Biggest social media platforms by users
Global EV market share by manufacturer
International tourist arrivals by world region
Global annual CO₂ emissions
Browse recent statistics
Artificial intelligence (AI) worldwide
TikTok
Nvidia
E-commerce worldwide
Global GDP
Instagram
Apparel market worldwide
Video gaming worldwide
Global renewable energy industry
Influencer marketing worldwide
Browse recent topics
Consumer Trends 2026
Artificial Intelligence: in-depth market analysis
E-commerce challenges
Global economy
TikTok
Luxury goods: in-depth market analysis
Electric vehicles: A global overview
Video gaming worldwide
Travel and tourism trends 2026
Battery recycling worldwide
Browse recent reports
Explore the tool
Explore Classic mode
Advertising & Media
eCommerce
Consumer
Finance
Global Indicators
Health
Industrial
Mobility
Technology
Explore Market Insights
eCommerce Insights
Research AI
Book a demo
All integrations
Developer docs
Explore Statista Connect
Research
Strategy & Consulting
Marketing
Media & PR
Explore AI assistants
Marketing
Research & Development
Strategy
Sales
Find the fact
Tell the story
Win the pitch
Understand the market
Develop your strategy
Academia
Agencies
Consultancies
Consumer goods
Finance
Tech
Research solutions
Strategy consulting
Communication services
Explore Statista+
Statista R
Statista Healthcare
About Statista
First steps & help center
Webinar & training hub
Success stories
Individuals & Small Teams
Businesses & Enterprises
Academia & Government
English
Deutsch
Daily Data
Infographics on the topic "coronavirus"
Covid-19
Apr 29, 2021
This chart shows the share of British adults that are Covid-19 vaccine willing/hesitant.
More Information
COVID-19 vaccine rollout
Apr 29, 2021
This chart shows the weekly number of COVID-19 vaccine doses administered in EU/EEA countries, by vaccine brand.
More Information
COVID-19
Apr 29, 2021
This chart shows the highest-ranked countries/regional economies on the Bloomberg COVID Resilience Ranking (as of April 26, 2021).
More Information
COVID-19 Vaccines
Apr 28, 2021
This chart shows how the Biden administration met its vaccine goals for Biden's first 100 days in office.
More Information
Covid-19 Pandemic
Apr 28, 2021
This chart shows Covid-19 vaccination doses administered per 100 people as of February 02, 2021.
More Information
Covid-19 Outbreak
Apr 27, 2021
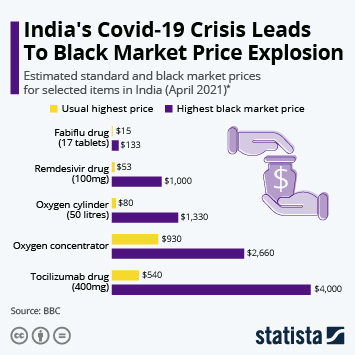
This chart shows the estimated standard and black market prices for selected items in India.
More Information
COVID-19 in India
Apr 26, 2021
This chart shows India's share of global new COVID-19 cases and deaths.
More Information
Coronavirus
Apr 26, 2021
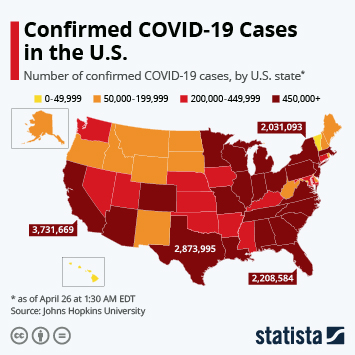
This chart shows the U.S. states which experienced coronavirus cases during the outbreak of the disease in 2021.
More Information
WFH
Apr 23, 2021
This chart shows survey responses among workers who engaged in remote work during the pandemic (2021).
More Information
COVID-19
Apr 23, 2021
This chart shows the share of respondents from selected countries who said they would get/have gotten vaccinated against COVID-19 (in...
More Information
COVID-19 Travel
Apr 19, 2021
This chart shows facts and figures on the travel bubble established between Australia and New Zealand in connection with the coronavirus...
More Information
COVID-19
Apr 16, 2021
This chart the 7-day average of new cases per one million of population on Jan 1/Apr 15 (2021) in countries where COVID-19 spread was...
More Information
COVID-19
Apr 16, 2021
This chart shows survey responses from selected countries on how long it will take to return to a pre-COVID life (as of Feb/Mar 2021).
More Information
Pandemic
Apr 15, 2021
This chart compares the annual change to quarterly GDP in selected countries in 2020 compared to the OECD average.
More Information
COVID-19 vaccines
Apr 14, 2021
This chart shows the total number of COVID-19 vaccine doses administered in the U.S. by manufacturer.
More Information
COVID-19 Vaccination
Apr 14, 2021
This chart shows the total number of COVID-19 vaccine doses distributed and administered in the United States.
More Information
Pandemic
Apr 13, 2021
This chart shows the 7-day average new Covid-19 cases per 100,000 inhabitants in selected European countries in April 2021.
More Information
Covid-19
Apr 13, 2021
This chart shows the estimated Covid-19 reproduction number in Israel.
More Information
Covid-19
Apr 13, 2021
This chart shows daily new Covid-19 cases and the 7-day rolling average in Israel.
More Information
Exports by State
Apr 12, 2021
This chart shows the U.S. states with most exports (in billion U.S. dollars).
More Information
COVID-19 Vaccinations
Apr 9, 2021
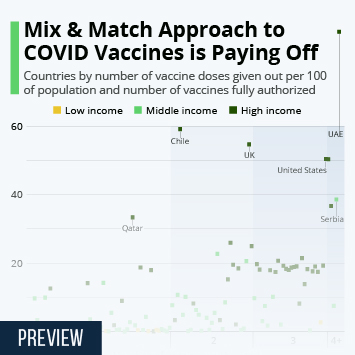
This chart shows countries by number of vaccine doses given out per 100 of population and number of vaccines fully authorized.
More Information
COVID-19 Vaccine rollout
Apr 7, 2021
This chart shows how many COVID-19 vaccine doses per 100 people have been administered in the EU, UK and United States.
More Information
Covid-19 Pandemic
Apr 7, 2021
This chart shows export requests for Covid-19 vaccine doses granted by the EU.
More Information
COVID-19
Apr 7, 2021
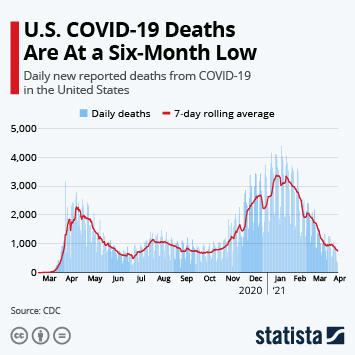
This chart shows daily new reported deaths from COVID-19 in the United States.
More Information
Covid-19
Apr 6, 2021
This chart shows the seven-day average number of Covid-19 vaccinations given in the UK in 2021.
More Information
COVID-19 Vaccination
Apr 6, 2021
This chart shows survey responses about COVID-19 vaccinations in India (2020/21).
More Information
COVID-19
Apr 1, 2021
This chart shows the 7-day rolling average of daily new COVID-19 cases per million of population in the most affected U.S. states.
More Information
Covid-19 Pandemic
Apr 1, 2021
This chart shows the number of deaths for all leading causes of death in the U.S. in 2020.
More Information
Coronavirus Vaccine
Mar 31, 2021
This chart shows COVID-19 vaccine exports from India, split into commercial deliveries and COVAX deliveries (in million doses).
More Information
Covid-19 Pandemic
Mar 30, 2021
Percentage change in visitor numbers to the world's 10 most visited art museums.
More Information
Education
Mar 29, 2021
This chart shows the number of children in the world below the minimum proficiency level in reading.
More Information
Biden Press Conference
Mar 25, 2021
This chart shows the average number of press conference held by sitting U.S. presidents and days until first solo conference.
More Information
COVID-19 in India
Mar 24, 2021
This charts shows the number of active coronavirus cases and new deaths in the most effective Indian states (as of March 23, 2021).
More Information
Covid-19 Outbreak
Mar 24, 2021
This chart shows estimated Covid-19 vaccine doses produced compared to total vaccine production pre-Covid-19.
More Information
Korean Exports
Mar 23, 2021
This chart shows the change in the export of selected products from South Korea in January and February 2021 (compared to Jan-Feb 2020).
More Information
Covid-19 Outbreak
Mar 23, 2021
This chart shows the total number of Covid-19 vaccine doses produced by country.
More Information
Economic Impact of COVID-19
Mar 23, 2021
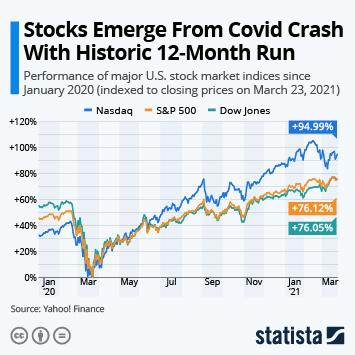
This chart shows the performance of major U.S. stock market indices since January 2020.
More Information
COVID-19 Second Wave
Mar 23, 2021
This chart shows coronavirus restrictions imposed in Europe during the second wave of the coronavirus pandemic (as of March 12, 2021).
More Information
Covid-19 Outbreak
Mar 23, 2021
This chart shows cumulative expected vaccine deliveries to the EU-27, Norway & Iceland in 2021.
More Information
Coronavirus
Mar 19, 2021
This chart presents a comparison of cumulative monthly UK government borrowing in 2019/20 and 2020/21.
More Information
Hate Crime
Mar 17, 2021
This chart shows overall and anti-Asian hate crime reported to police in America's 15 largest cities in 2019 and 2020.
More Information
Air Pollution
Mar 16, 2021
This chart shows the levels of average PM2.5 air pollution in Asian countries/regional economies in 2020.
More Information
Covid-19 Pandemic
Mar 15, 2021
This chart shows Covid-19 vaccine doses administered per day since January 01, 2021.
More Information
Stock market
Mar 12, 2021
This chart shows the number of SPAC IPOs in the U.S. between 2009-2021.
More Information
Coronavirus
Mar 12, 2021
This chart shows the states with the highest/lowest percentage of their population with at least one COVID-19 vaccine dose.
More Information
Coronavirus
Mar 12, 2021
This chart shows the number of daily COVID-19 cases in U.S. children from Oct. 2020 to March 4, 2021.
More Information
Covid-19 Outbreak
Mar 11, 2021
This chart shows the composition of the American Rescue Plan Act (in billion U.S. dollars).
More Information
COVID-19
Mar 10, 2021
This chart shows the number of daily new COVID-19 infections in the EU, the U.S., India and Brazil in 2020 and 2021 (two-week rolling...
More Information
Impact of COVID-19 on the job market
Mar 9, 2021
This chart shows the percentage of respondents who would move to each country for work.
More Information
Economic Impact of COVID-19
Mar 9, 2021
This chart shows global GDP projections made in November 2019 and March 2021, indexed to the level of Q4 2019.
More Information
Covid-19 Outbreak
Mar 9, 2021
This chart shows the status of travel restrictions for international tourism as of February 01, 2021.
More Information
Cruise Lines
Mar 9, 2021
This chart shows revenue of the largest cruise lines in 2019 and 2020.
More Information
Super Rich Populations
Mar 8, 2021
This chart shows the forecast five-year growth in UHNWI populations (2020-2025).
More Information
Container Shipping
Mar 8, 2021
This chart shows the Shanghai and Ningbo Containerized Freight Indices in 2020/21.
More Information
Covid-19 outbreak
Mar 5, 2021
This chart shows the share of respondents who would support easing Covid-19 restrictions.
More Information
Retail
Mar 5, 2021
This chart shows annual change in UK retail spending in leisure sector markets in 2020.
More Information
Foreign policy
Mar 4, 2021
This chart shows the percentage of U.S. adults who say America should remain a member of each group.
More Information
Emissions
Mar 2, 2021
This chart shows the percent year-over-year change in global carbon dioxide emissions in 2020.
More Information
Covid-19
Mar 2, 2021
This chart shows the change in movements in the UK after the coronavirus lockdown as recorded by Google location data, by category.
More Information
South Korea
Mar 2, 2021
This chart shows the monthly change in exports (year-on-year) from South Korea.
More Information
Food Security
Mar 2, 2021
This chart shows index scores for the affordability, availability, natural resources, safety and quality of food in 2020.
More Information
COVID-19
Mar 1, 2021
This chart shows COVID-19 deaths per 100,000 of the population in the 10 worst affected countries.
More Information
Homelessness
Feb 26, 2021
This chart looks at figures related to rough sleeping in England in January 2021 and the effects of a government initiative to reduce...
More Information
Short-Term Rentals
Feb 25, 2021
This chart shows the year-over-year change in booked Airbnb and Vrbo listings worldwide.
More Information
Covid-19 Pandemic
Feb 25, 2021
This chart shows confirmed orders for the Janssen Ad26.COV2.S vaccine.
More Information
Travel
Feb 24, 2021
This chart compares selected KPIs of Heathrow Airport in 2019 and 2020.
More Information
COVID-19 Vaccination
Feb 24, 2021
This chart shows public support for mandatory COVID-19 vaccination in selected countries.
More Information
Coronavirus
Feb 23, 2021
This chart shows the percentage of U.S. adults who will get a coronavirus vaccine once it becomes available.
More Information
Covid-19 Pandemic
Feb 23, 2021
This chart shows U.S. Covid-19 deaths compared to the number of Americans who died in selected wars.
More Information
Housing
Feb 22, 2021
This chart shows the number of new privately-owned housing units started in the U.S. between Jan. 2020 and Jan. 2021 (in thousands).
More Information
COVID-19 Deaths
Feb 22, 2021
This chart shows cumulative COVID-19 deaths for the worst affected countries as of February 21, 2021.
More Information
Covid-19 Pandemic
Feb 22, 2021
This chart shows countries that have not started Covid-19 vaccinations.
More Information
Retail
Feb 19, 2021
This chart shows estimated year-over-year change in retail sales in the U.S. in January 2021.
More Information
Cryptocurrency
Feb 18, 2021
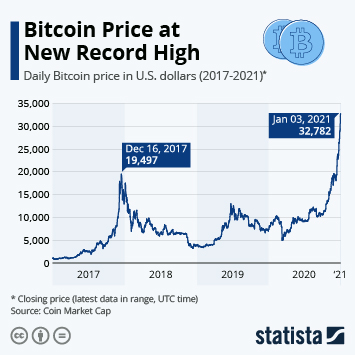
This chart shows changes in the daily value of Bitcoin (2017-2021).
More Information
Health
Feb 18, 2021
This chart shows the Covid-19 cases reported per 1,000 tests conducted in the United Kingdom.
More Information
Education
Feb 17, 2021
This chart shows the percentage of U.S. voters who say schools should wait to reopen until all teachers are vaccinated.
More Information
Stock market
Feb 16, 2021
This chart shows the percentage of investors who describe the current stock market in each way.
More Information
GDP
Feb 16, 2021
This chart shows the annualized quarter on-quarter real GDP growth in Japan between 2008 and 2020.
More Information
Covid-19 Pandemic
Feb 16, 2021
This chart shows the number of countries using selected Covid-19 vaccines as of February 16, 2021.
More Information
Shipping
Feb 16, 2021
This chart shows seafarer abandonment cases by country in 2020.
More Information
E-Commerce
Feb 15, 2021
This chart shows the share of e-commerce in food retail spending by world region.
More Information
Covid-19 Outbreak
Feb 15, 2021
This chart shows the number of people hospitalized with Covid-19 in the United States.
More Information
Covid-19
Feb 15, 2021
This chart shows the actual and projected number of UK adults to have received the first dose of a Covid-19 vaccination.
More Information
Remittances
Feb 15, 2021
This chart shows overseas Filipinos' annual personal remittances (in billion U.S. dollars) and growth (in percent).
More Information
Economy
Feb 12, 2021
This chart shows the annual change in UK GDP from 1949 to 2020.
More Information
Deportations
Feb 11, 2021
This chart shows the number of foreign nationals subject to formal deportation proceedings vs. informal returns in the U.S.
More Information
Unemployment
Feb 11, 2021
This chart shows the percentage of unemployed U.S. adults who said they feel each way about future job prospects.
More Information
COVID-19 in Japan
Feb 10, 2021
This chart shows the share COVID-19 patients have in hospital occupancy rates in Japanese prefectures as of Feb 3, 2021.
More Information
Covid-19 Pandemic
Feb 10, 2021
This chart shows Covid-19 cases in the United States involving emerging variants.
More Information
Coronavirus vaccine
Feb 10, 2021
This chart shows the percentage of U.S. adults who anticipate when they'll return to normal in-person gatherings.
More Information
7
/
15
Contact
Get in touch with us. We are happy to help.
Do you still have questions?
Feel free to contact us anytime using our
contact form
or visit our
FAQ page
.
Your contact to the Infographics Newsroom
Felix Richter
Data Journalist
felix.richter@statista.com
+49 (40) 284 841 557