Skip to main content
Consumer Goods & FMCG
E-Commerce
Economy & Politics
Energy & Environment
Health, Pharma & Medtech
Internet
Media
Technology & Telecommunications
Transportation & Logistics
Travel, Tourism & Hospitality
View all industries
Global data volume growth
Global AI market size
Number of generative AI users worldwide
Global inflation rate
Retail e-commerce sales worldwide
Largest economies worldwide
Biggest social media platforms by users
Global EV market share by manufacturer
International tourist arrivals by world region
Global annual CO₂ emissions
Browse recent statistics
Artificial intelligence (AI) worldwide
TikTok
Nvidia
E-commerce worldwide
Global GDP
Instagram
Apparel market worldwide
Video gaming worldwide
Global renewable energy industry
Influencer marketing worldwide
Browse recent topics
Consumer Trends 2026
Artificial Intelligence: in-depth market analysis
E-commerce challenges
Global economy
TikTok
Luxury goods: in-depth market analysis
Electric vehicles: A global overview
Video gaming worldwide
Travel and tourism trends 2026
Battery recycling worldwide
Browse recent reports
Explore the tool
Explore Classic mode
Advertising & Media
eCommerce
Consumer
Finance
Global Indicators
Health
Industrial
Mobility
Technology
Explore Market Insights
eCommerce Insights
Research AI
Book a demo
All integrations
Developer docs
Explore Statista Connect
Research
Strategy & Consulting
Marketing
Media & PR
Explore AI assistants
Marketing
Research & Development
Strategy
Sales
Find the fact
Tell the story
Win the pitch
Understand the market
Develop your strategy
Academia
Agencies
Consultancies
Consumer goods
Finance
Tech
Research solutions
Strategy consulting
Communication services
Explore Statista+
Statista R
Statista Healthcare
About Statista
First steps & help center
Webinar & training hub
Success stories
Individuals & Small Teams
Businesses & Enterprises
Academia & Government
English
Deutsch
Daily Data
Infographics on the topic "inflation"
Live Events
Aug 28, 2026
This chart shows the share of U.S. respondents who purchased tickets online from the following providers.
More Information
Youth Unemployment
Aug 26, 2026
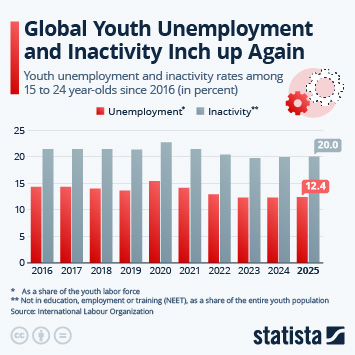
This chart shows youth unemployment and inactivity rates among 15 to 24 year-olds since 2016.
More Information
Apple
Aug 24, 2026
This chart shows the change in Apple's share price since Tim Cook was named CEO on August 24, 2011.
More Information
Travel prices
Aug 14, 2026
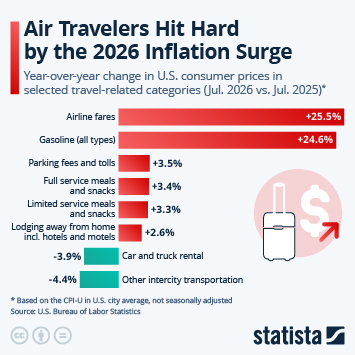
This chart shows the change in travel-related consumer prices in the United States between July 2025 and July 2026.
More Information
Airport traffic
Aug 14, 2026
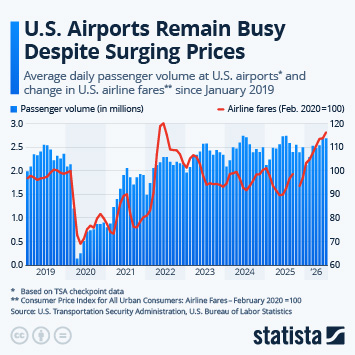
This chart shows the average daily passenger volume at U.S. airports and the change in U.S. airline fares since January 2019.
More Information
Consumer Price Index
Aug 13, 2026
This chart shows the year-over-year change in the Consumer Price Index for All Urban Consumers in the U.S.
More Information
Real wages in the United States
Aug 13, 2026
This chart shows the cumulative change in nominal and real wages as well as the Consumer Price Index in the United States since January...
More Information
Cost of Living Crisis
Aug 13, 2026
This chart shows what Americans think are the biggest challenges they currently face.
More Information
U.S. Economy
Jul 31, 2026
This chart shows the quarterly change in real GDP and the price index for personal consumption expenditure in the U.S.
More Information
Interest rates
Jul 30, 2026
This chart shows the upper limit of the actual and expected federal funds target rate range.
More Information
Health Care Cost
Jul 6, 2026
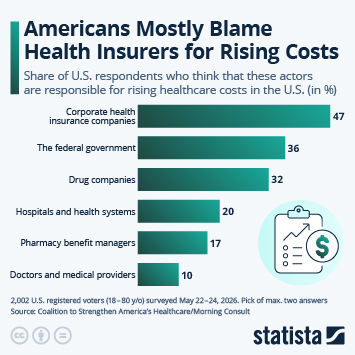
This chart shows the share of U.S. respondents who think that these actors are responsible for rising healthcare costs in the U.S.
More Information
Healthcare
Jul 6, 2026
This chart shows the number and percentage of U.S. citizens without health insurance coverage in the U.S.
More Information
Health Insurance
Jul 6, 2026
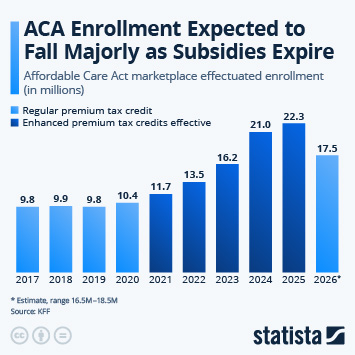
This chart shows Affordable Care Act marketplace effectuated enrollment.
More Information
250 Years of U.S. Independence
Jul 3, 2026
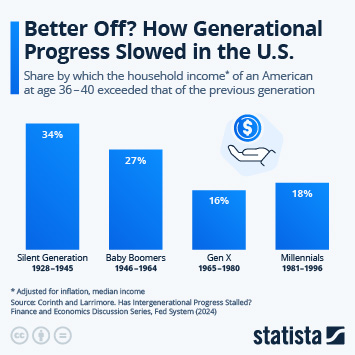
This chart shows the share by which the household income of an American at age 36-40 exceeded that of the previous generation.
More Information
Housing Market
Jun 25, 2026
This chart shows the share of U.S. adults saying that now is a good time to buy a house.
More Information
Housing Market
Jun 25, 2026
This chart compares the median household income in the United States to the median price of new houses sold in the country.
More Information
Real Wages
Jun 18, 2026
This chart shows the year-over-year change in consumer prices, real and nominal hourly earnings in the United States.
More Information
Income
Jun 18, 2026
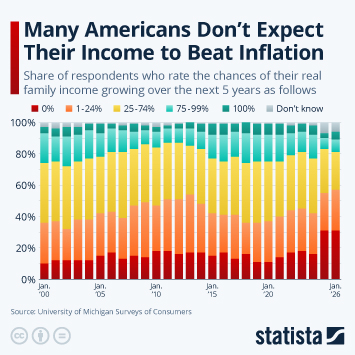
This chart shows how Americans perceive their chances of real income growth over the next five years.
More Information
Inflation Expectations
Jun 15, 2026
This chart shows the median expected inflation rate one year and three years ahead according to U.S. consumers.
More Information
Inflation
Jun 15, 2026
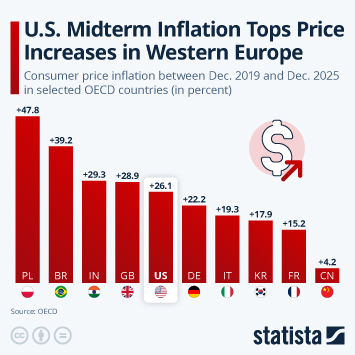
This chart shows consumer price inflation between Dec. 2019 and Dec. 2025 in selected OECD countries.
More Information
Inflation
Jun 15, 2026
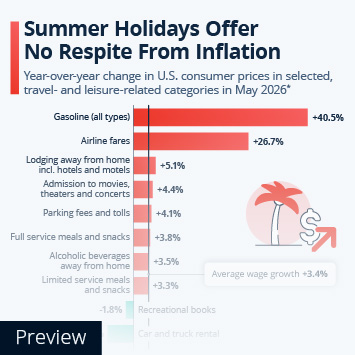
This chart shows the increase in U.S. consumer prices in travel- and leisre-related categories between May 2025 and May 2026.
More Information
Inflation
May 29, 2026
This chart shows the share of respondents who say the following issues are among the most important facing the U.S.
More Information
Domestic Real Estate
May 27, 2026
This chart shows the monthly purchase-only index for house prices in the United States.
More Information
Housing Market
May 27, 2026
This chart shows the median house price and median days on the market for housing in the U.S. (as of Q1 2026).
More Information
U.S. Politics
May 26, 2026
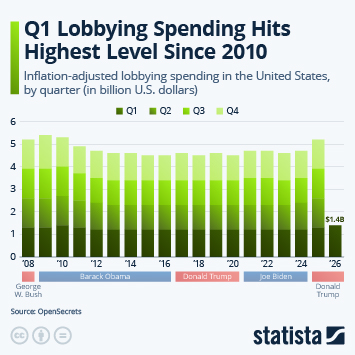
This chart shows inflation-adjusted lobbying spending in the United States, by quarter.
More Information
Consumer debt
May 19, 2026
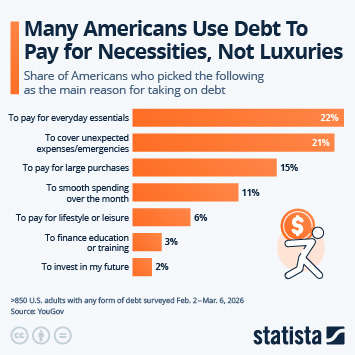
This chart shows why Americans take on debt.
More Information
society
May 18, 2026
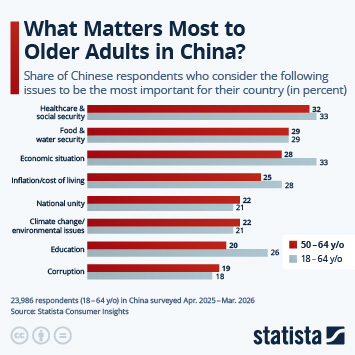
This chart shows the share of respondents who consider the following issues to be the most important for their country.
More Information
Personal Finances
May 13, 2026
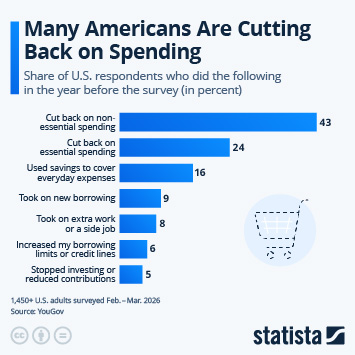
This infographic shows a selection of spending behaviors in the United States.
More Information
U.S. Labor Market
May 11, 2026
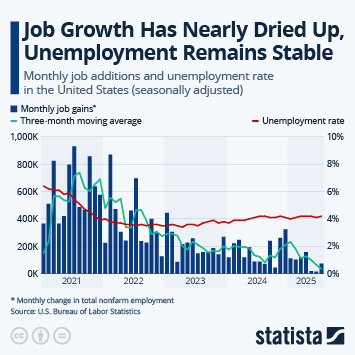
This chart shows monthly job growth and unemployment rate in the United States.
More Information
Gasoline prices
May 7, 2026
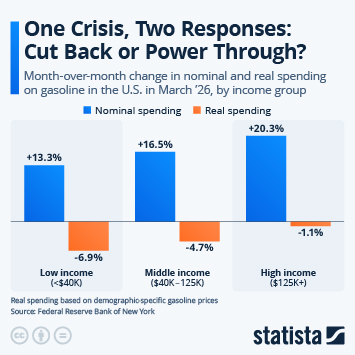
This chart shows how gasoline spending changed in March 2026 due to the steep price increase caused by the war in Iran and the blockage...
More Information
2
/
6
Contact
Get in touch with us. We are happy to help.
Do you still have questions?
Feel free to contact us anytime using our
contact form
or visit our
FAQ page
.
Your contact to the Infographics Newsroom
Felix Richter
Data Journalist
felix.richter@statista.com
+49 (40) 284 841 557