Skip to main content
Consumer Goods & FMCG
E-Commerce
Economy & Politics
Energy & Environment
Health, Pharma & Medtech
Internet
Media
Technology & Telecommunications
Transportation & Logistics
Travel, Tourism & Hospitality
View all industries
Global data volume growth
Global AI market size
Number of generative AI users worldwide
Global inflation rate
Retail e-commerce sales worldwide
Largest economies worldwide
Biggest social media platforms by users
Global EV market share by manufacturer
International tourist arrivals by world region
Global annual CO₂ emissions
Browse recent statistics
Artificial intelligence (AI) worldwide
TikTok
Nvidia
E-commerce worldwide
Global GDP
Instagram
Apparel market worldwide
Video gaming worldwide
Global renewable energy industry
Influencer marketing worldwide
Browse recent topics
Consumer Trends 2026
Artificial Intelligence: in-depth market analysis
E-commerce challenges
Global economy
TikTok
Luxury goods: in-depth market analysis
Electric vehicles: A global overview
Video gaming worldwide
Travel and tourism trends 2026
Battery recycling worldwide
Browse recent reports
Explore the tool
Explore Classic mode
Advertising & Media
eCommerce
Consumer
Finance
Global Indicators
Health
Industrial
Mobility
Technology
Explore Market Insights
eCommerce Insights
Research AI
Book a demo
All integrations
Developer docs
Explore Statista Connect
Research
Strategy & Consulting
Marketing
Media & PR
Explore AI assistants
Marketing
Research & Development
Strategy
Sales
Find the fact
Tell the story
Win the pitch
Understand the market
Develop your strategy
Academia
Agencies
Consultancies
Consumer goods
Finance
Tech
Research solutions
Strategy consulting
Communication services
Explore Statista+
Statista R
Statista Healthcare
About Statista
First steps & help center
Webinar & training hub
Success stories
Individuals & Small Teams
Businesses & Enterprises
Academia & Government
English
Deutsch
Daily Data
Infographics on the topic "inflation"
investments
Apr 29, 2026
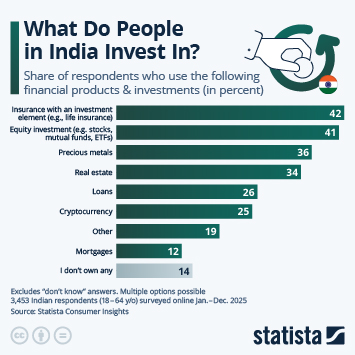
This chart shows the share of respondents who use the following financial products and investments.
More Information
Gold Reserves
Apr 29, 2026
This chart shows the countries with largest gold reserves worldwide as of December 2025 (in metric tons).
More Information
Nuclear Industry
Apr 24, 2026
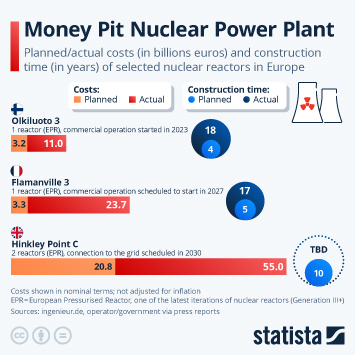
This infographic shows the costs and construction times of EPR nuclear reactors in Europe.
More Information
S&P 500
Apr 23, 2026
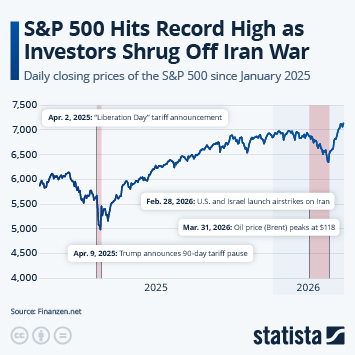
This chart shows the S&P 500 index since January 2025.
More Information
Key issues
Apr 13, 2026
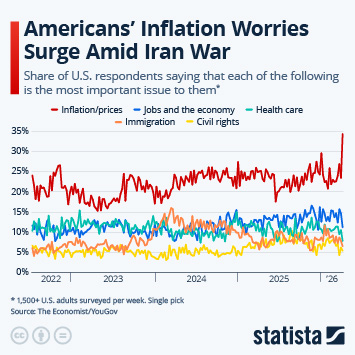
This chart shows which issues Americans say are most important to them.
More Information
Food Prices
Apr 9, 2026
This chart shows the UN Global Food Price Index.
More Information
U.S. Economy
Mar 20, 2026
This chart shows FOMC members' median projections for PCE inflation, real GDP growth and unemployment (as of March 2026).
More Information
Consumer Sentiment
Mar 20, 2026
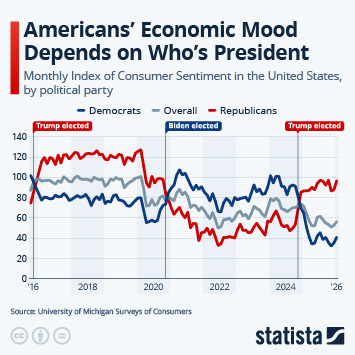
This chart shows how Americans change their views of the economy based on who is president.
More Information
Wealth Inequality
Mar 11, 2026
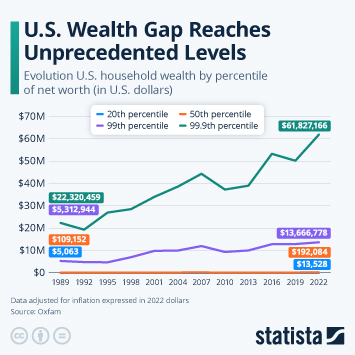
This infographic shows the evolution of U.S. household wealth by percentile of net worth, in U.S. dollars.
More Information
Economy
Mar 11, 2026
This chart shows the share of adults that said they are worried about their financial future in 2025, by country.
More Information
Iran War
Mar 9, 2026
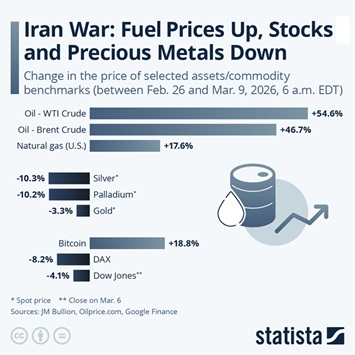
This chart shows the change in the price of selected assets/commodity benchmarks (between Feb. 26 and Mar. 9, 2026, 6 a.m. EDT).
More Information
Inflation
Mar 6, 2026
This chart shows which issues Americans think are most important in March 2026 and how they think President Trump handles inflation.
More Information
Asia
Feb 16, 2026
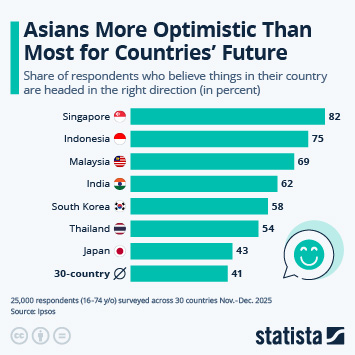
This infographic shows the share of respondents in selected Asian countries who believe things in their country are headed in the right...
More Information
Inflation in the U.S.
Feb 16, 2026
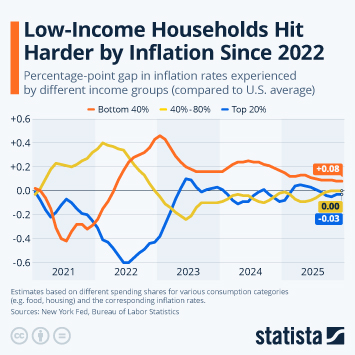
This chart shows how households from different income groups have experienced the inflation crisis over the past few years.
More Information
Inflation
Feb 16, 2026
This chart explains the difference between disinflation and deflation but comparing the cumulative change in prices to the inflation...
More Information
Money
Feb 13, 2026
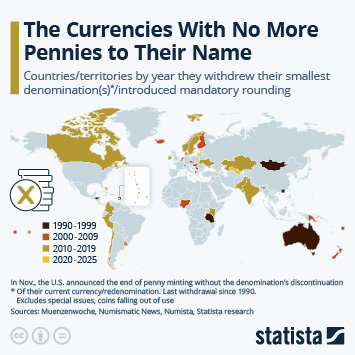
This chart shows the countries/territories by year they withdrew their smallest denomination(s)/introduced mandatory rounding .
More Information
Finances
Feb 12, 2026
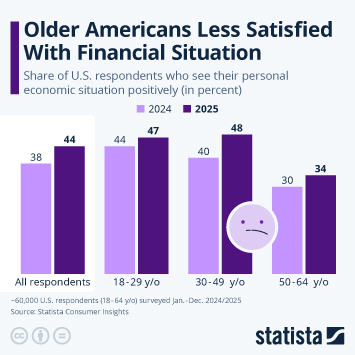
This chart shows the share of respondents in selected countries who see their personal economic situation positively (in percent).
More Information
Corruption
Feb 11, 2026
This chart shows the share of respondents in selected countries that view corruption as a top 3 worry in their country.
More Information
U.S. Labor Market
Feb 10, 2026
This chart shows the number of unemployed persons and job openings in the United States.
More Information
Advertising
Feb 6, 2026
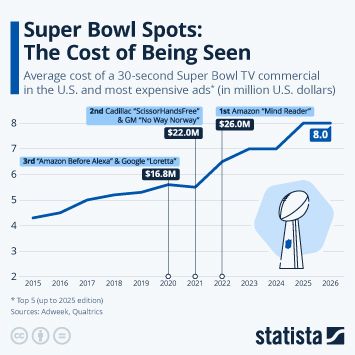
This infographic shows the average cost of a 30-second Super Bowl TV commercial in the U.S. and the top 5 most expensive ads (million...
More Information
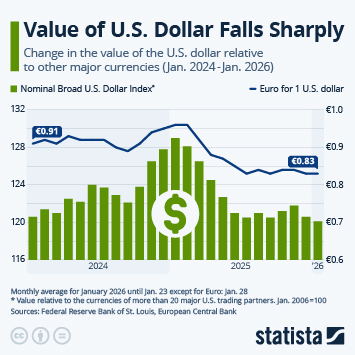
Currencies
Feb 2, 2026
This chart shows the change in the value of the U.S. dollar relative to other major currencies (Jan. 2024-Jan. 2026).
More Information
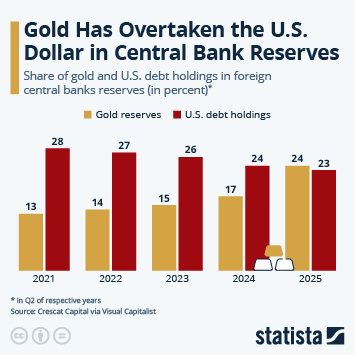
De-dollarization
Jan 30, 2026
This chart shows the share of gold and U.S. debt holdings in foreign central banks reserves from Q2 2021 to Q2 2025.
More Information
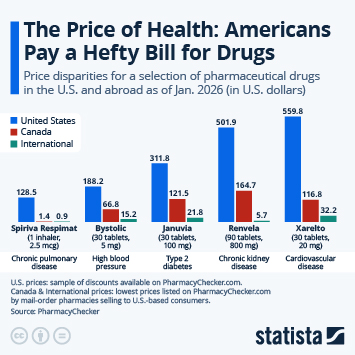
Drug prices
Jan 9, 2026
This infographic compares the price of a selection of pharmaceutical drugs in the U.S. and abroad as of Jan. 2026 (in U.S. dollars).
More Information
Entertainment
Dec 19, 2025
This chart shows worldwide box office earnings of the highest-grossing movies of all time.
More Information
Movie Industry
Dec 19, 2025
This chart shows annual box office earnings and ticket sales in North America since 2000.
More Information
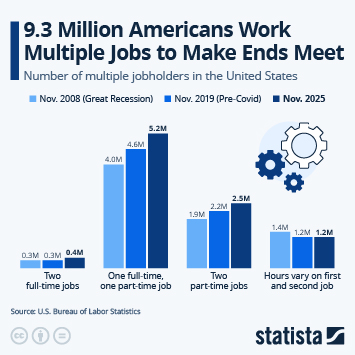
U.S. Labor Market
Dec 17, 2025
This chart shows the number of Americans working multiple jobs.
More Information
Tourism recovery after Covid-19
Dec 15, 2025
This chart shows international tourist arrivals worldwide since 1990.
More Information
Middle East
Dec 5, 2025
This chart shows Iran's real GDP growth and inflation rate since 2010.
More Information
Personal Finances
Dec 2, 2025
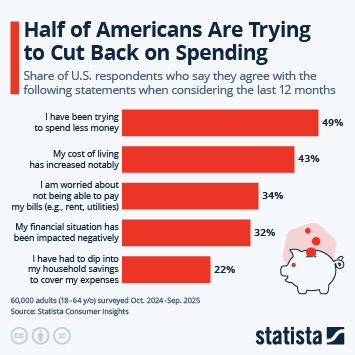
This chart shows the share of U.S. respondents who say they agree with a selection of statements when considering the last 12 months.
More Information
Holiday Shopping
Nov 27, 2025
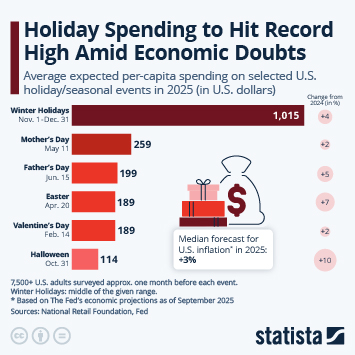
This chart shows the average expected per-capita spending on selected U.S. holiday/seasonal events in 2025 (in U.S. dollars), and change...
More Information
World Diabetes Day
Nov 26, 2025
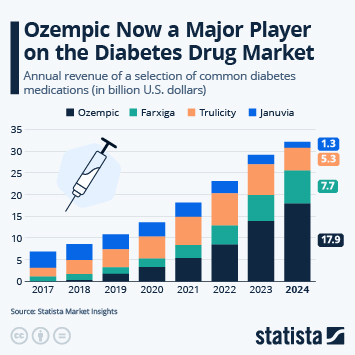
This chart shows the annual revenue of a selection of common diabetes medications (in billion U.S. dollars).
More Information
Thanksgiving
Nov 24, 2025
This chart shows the average costs of selected foods for a Thanksgiving meal for 10 people in 2025.
More Information
Epstein Files
Nov 17, 2025
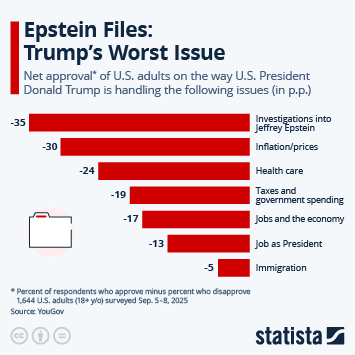
This chart shows the net approval of U.S. adults on the way U.S. President Donald Trump is handling the following issues (in p.p.).
More Information
Food Security
Nov 10, 2025
This chart shows the share of respondents that consider food and water supply one of the biggest challenges of their country.
More Information
Article sponsorisé par Booking.com
Nov 6, 2025
Cette infographie présente les principales préoccupations des Européens concernant les voyages en Europe.
More Information
Economy
Oct 30, 2025
This chart shows central banks' main policy interest rates in the United States and Europe.
More Information
Gold
Oct 29, 2025
This chart shows the estimated above-ground gold stocks by category.
More Information
Gold
Oct 29, 2025
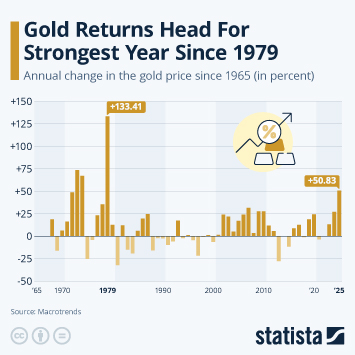
This chart shows the annual change in the gold price since 1965 (in percent).
More Information
Interest Rates
Sep 16, 2025
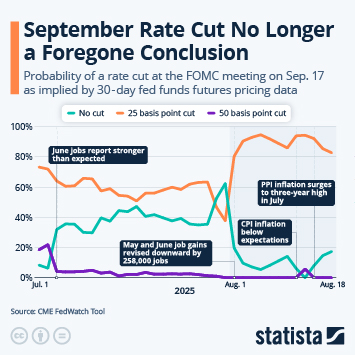
This chart shows the probability of a rate cut at the upcoming FOMC meeting in September.
More Information
U.S. Census Bureau
Sep 11, 2025
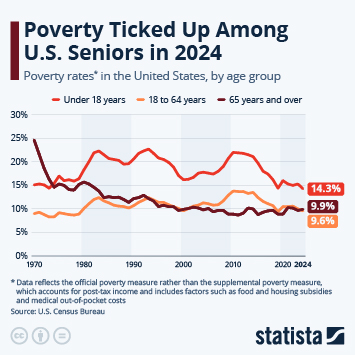
This chart shows poverty rates* in the United States, by age group (in percent).
More Information
Minimum Wage
Sep 1, 2025
This chart shows State minimum wage legislation as of Sep. 1, 2025.
More Information
20 Years After Katrina
Aug 28, 2025
This chart shows the U.S. damages and death tolls for the costliest hurricanes on record to impact the U.S. (as of Aug 2025).
More Information
Plant-Based Foods
Aug 22, 2025
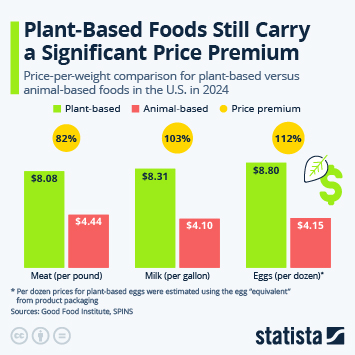
This chart shows the average price premium of plant based meat and milk alternatives in the United States in 2024.
More Information
Consumer and Producer Prices
Aug 19, 2025
This chart shows the monthly change in the core Consumer Price Index and the core Producer Price Index in the U.S.
More Information
Bitcoin Treasuries
Aug 1, 2025
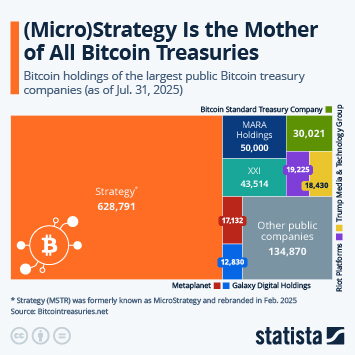
This chart shows the public companies with the largest bitcoin holdings as of July 31, 2025.
More Information
Inflation
Jul 30, 2025
This chart shows the IMF's latest inflation forecast for the United States, the G7 and the Euro area.
More Information
Inflation
Jul 30, 2025
This chart shows projected annual inflation by country in 2025.
More Information
World Hunger
Jul 29, 2025
This chart shows the number of malnourished people worldwide from 2015 to 2030 (projection).
More Information
Food Prices
Jul 29, 2025
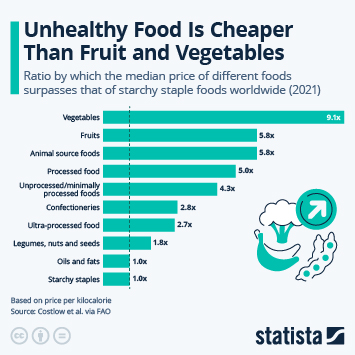
This chart shows the ratio by which the median price of different foods surpasses that of starchy staple foods worldwide (2021).
More Information
Health
Jul 29, 2025
This chart shows the share of the population experiencing moderate/severe food insecurity, by region.
More Information
Sponsored post by Booking.com
Jul 29, 2025
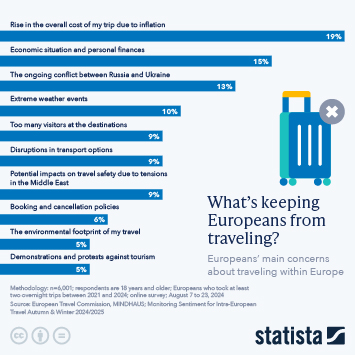
This infographic shows Europeans' main concerns about traveling within Europe
More Information
Inflation
Jul 25, 2025
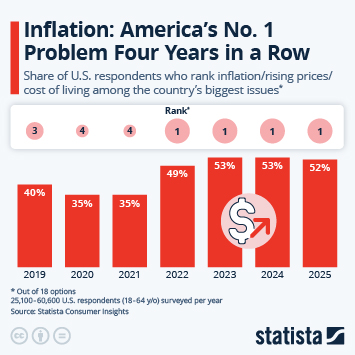
This chart shows the share of U.S. respondents who rank inflation/rising prices/cost of living among the country's biggest issues.
More Information
Consumer Price Index
Jul 16, 2025
This chart shows the relative importance of the eight major expenditure categories within the Consumer Price Index.
More Information
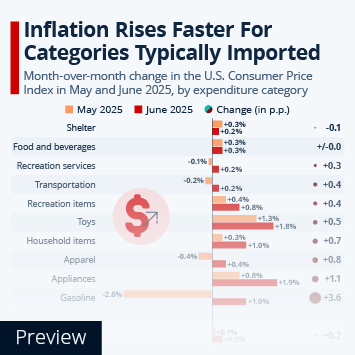
Inflation
Jul 16, 2025
This chart shows the month-over-month change in the U.S. Consumer Price Index in May and June 2025, by expenditure category.
More Information
Independence Day
Jul 4, 2025
This chart shows the average costs of a July 4th cookout for 10 people in 2025.
More Information
Jobs Market
Jul 3, 2025
This chart shows total nonfarm employment in the United States.
More Information
Housing
Jun 27, 2025
This chart shows the change in home prices between Q1 2019 and Q1 2025 in selected U.S. metro areas (in percent).
More Information
Medicaid
Jun 27, 2025
This chart shows the projected effects of the proposed House budget bill and its components on U.S. uninsured and death numbers.
More Information
Housing
Jun 27, 2025
This chart shows the share of renting and owning households which were cost-burdened in 2023, by state.
More Information
Food and Hospitality
Jun 20, 2025
This chart shows seasonally adjusted sales of food services and drinking places in the United States.
More Information
U.S. Economy
Jun 16, 2025
This chart shows how the U.S. economy navigated through the inflation crisis.
More Information
Economic Outlook
Jun 3, 2025
This chart shows the OECD's global GDP growth projections for 2025 and 2026.
More Information
OECD
Jun 3, 2025
This chart shows real GDP growth projections for 2025 and 2026 in selected countries.
More Information
Issues
May 20, 2025
This chart shows the top 5 most often citied major issues for the U.S., by political orientation (in percent).
More Information
U.S. Trade Deficit
May 5, 2025
This chart shows the U.S. trade deficit in goods and services trade.
More Information
Consumer Spending
Apr 10, 2025
This chart shows the cities with the highest consumer spending in the world, by year.
More Information
U.S. Concerns
Apr 10, 2025
This chart shows the share of U.S. respondents who said the following were (very) serious problems for the country (in percent).
More Information
Stock Market
Apr 8, 2025
This chart shows the length and depth of the latest S&P 500 bear markets.
More Information
Stock Market
Apr 7, 2025
This chart shows how international stock market indexes have developed since Donald Trump's inauguration on January 20, 2025.
More Information
Tariffs
Mar 31, 2025
This chart shows the public view of the effect of tariffs on the average American.
More Information
Consumer Spending
Mar 31, 2025
This chart shows the months change in real consumer spending and personal saving at annual rates in the United States.
More Information
International trade
Mar 17, 2025
This chart shows the estimated GDP effect of additional tariffs.
More Information
Syria
Mar 14, 2025
This chart shows the top 5 exports from Syria in 2010 and 2023 (in billion U.S. dollars).
More Information
Tariffs
Mar 4, 2025
This chart shows the estimated change to below indicators in the case of 25-% tariffs between the U.S., Canada and Mexico.
More Information
Tariffs
Mar 4, 2025
This chart shows the effects of (hypothetical) tariffs on the increase of U.S. core inflation.
More Information
IMF Outlook
Feb 21, 2025
This chart shows real GDP growth projections for selected countries, by year.
More Information
German Election
Feb 21, 2025
This chart shows the age composition of eligible voters in the German federal election on February 2025.
More Information
German Elections
Feb 18, 2025
This chart shows which issues Germans consider most pressing in their country.
More Information
Tariffs vs. Inflation
Feb 13, 2025
This chart shows how Americans think tariffs will impact prices.
More Information
Food prices in the United States
Feb 13, 2025
This chart shows the change in prices of selected food items in the U.S. between January 2021 and January 2025.
More Information
Cost of Living
Feb 10, 2025
This chart shows the share of respondents from selected countries who answered yes to the below statements in 2024 (in percent).
More Information
China
Jan 20, 2025
This chart shows the profits of the industrial sector in China (in trillion U.S. dollars) and year-over-year change.
More Information
Real wages in the U.S.
Jan 20, 2025
This chart shows how average hourly nominal and real wages developed during under the Biden administration.
More Information
Global Risks
Jan 16, 2025
This chart shows experts' assessments of the most severe global risks over the next 2 and 10 years.
More Information
Road safety
Dec 6, 2024
This chart shows the estimated annual economic costs of motor vehicle crashes in the U.S.
More Information
Global Trade
Dec 2, 2024
This chart shows the world's leading merchandise exporters in 2000 and 2023.
More Information
Inflation
Nov 15, 2024
This chart shows how quickly consumer prices in different categories have risen in the United States since February 2020.
More Information
Renewables investment
Nov 13, 2024
This chart shows the public and private investment in climate-friendly technologies in the United States (in billion U.S. dollars).
More Information
Household Finances
Nov 7, 2024
This chart shows estimated cumulative excess savings built up during the pandemic and drawn down since
More Information
U.S. Presidential Election
Nov 7, 2024
This chart shows U.S. voters' views on the economy and how they voted in the 2024 U.S. presidential election.
More Information
3
/
6
Contact
Get in touch with us. We are happy to help.
Do you still have questions?
Feel free to contact us anytime using our
contact form
or visit our
FAQ page
.
Your contact to the Infographics Newsroom
Felix Richter
Data Journalist
felix.richter@statista.com
+49 (40) 284 841 557