Among one million websites receiving largest traffic, 2.6 percent was using header-bidding technology in June 2022. The same was true for eight percent of websites among the top 100 thousand and 12.5 percent among the top 10 thousand.
Adoption of header bidding worldwide in April 2021 and June 2022, by website traffic volume
Basic Account
Get to know the platform
You only have access to basic statistics.
This statistic is not included in your account.
Starter Account
The ideal entry-level account for individual users
- Instant access to 1m statistics
- Download in XLS, PDF & PNG format
- Detailed references
$189 USD $149 USD / Month *
in the first 12 months
Professional Account
Full access
Business Solutions including all features.
* Prices do not include sales tax.
Other statistics that may interest you Programmatic advertising worldwide
Overview
5
- Premium Statistic Programmatic ad spend worldwide 2017-2026
- Premium Statistic Programmatic ad spend growth worldwide 2018-2026
- Premium Statistic Digital ad spend worldwide 2017-2026, by purchase method
- Premium Statistic Ad revenue of pirate digital media worldwide 2020-2021, by ad type
- Premium Statistic Ad revenue of pirate digital media worldwide 2020-2021, by platform
Regional data
4
- Premium Statistic Programmatic ad spend worldwide 2021, by region
- Premium Statistic Distribution of programmatic ad spend worldwide 2021, by region
- Premium Statistic Programmatic share of digital ad spend worldwide 2022, by region
- Premium Statistic Programmatic ad spend CAGR worldwide 2018-2026, by region
Leading markets
7
- Premium Statistic Largest programmatic markets worldwide 2021
- Premium Statistic Leading programmatic markets worldwide 2022, by growth rate
- Premium Statistic Largest programmatic markets in Africa 2021
- Premium Statistic Largest programmatic markets in Asia-Pacific 2021
- Premium Statistic Largest programmatic markets in Europe 2021
- Premium Statistic Programmatic ad spend in North America 2021, by country
- Premium Statistic Largest programmatic markets in Latin America 2021
Players
7
- Premium Statistic Marketing automation software market size worldwide 2022-2031
- Premium Statistic Marketing automation solutions market share worldwide 2022
- Premium Statistic Revenue of advertising technology platforms 2020
- Premium Statistic Most used SSPs worldwide 2020
- Premium Statistic Teads revenue 2016-2022
- Basic Statistic Magnite revenue 2016-2022
- Premium Statistic Leading header-bidding technologies worldwide 2022
Insights from marketers
5
- Premium Statistic Top programmatic advertising challenges worldwide 2022
- Premium Statistic Ways marketers buy CTV inventories worldwide 2021
- Premium Statistic Ways marketers buy programmatic audio ads worldwide 2021
- Premium Statistic Changes in programmatic audio ad spending by marketers worldwide 2021
- Premium Statistic 
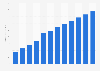
Header bidding adoption worldwide 2021-2022, by website traffic
Selected metrics
5
- Premium Statistic Programmatic ad fraud rate worldwide 2021
- Premium Statistic Programmatic ads brand suitability block rate worldwide 2019-2021
- Premium Statistic Programmatic ads brands suitability violation rate worldwide 2021
- Premium Statistic Programmatic video advertising viewability rate worldwide 2021
- Premium Statistic CTV ad fraud worldwide 2020-2021
Further related statistics
19
- Digital classifieds adoption among non-English users in India - by language 2016-2021
- Adoption rates of the Internet of Things (IoT) in the UK 2015, by industry
- AEB adoption in U.S. by brand MY 2016
- Worldwide 3D printing technology: current and intended acceptance by country, 2016
- Health and healthcare sector's new technology adoption barriers 2020
- Professional services industry's likely technology adoption rate 2020-2025
- Estimated adoption rates of Big Data in the UK 2020, by industry
- Online adoption readiness among non-English speakers in India - by language 2016
- Global 3D printing adoption rate by region, 2016 and 2021
- Adoption rate of telemedicine as of 2017, by provider type
- Colombia: financial inclusion index 2016-2017, by category
- Mining and metals industry's new technology adoption barriers 2020
- Adoption rates of Big Data collection in the UK 2015, by industry
- Adoption rate and likelihood of chatbots worldwide 2017
- Chile: financial inclusion index 2017, by category
- Use of commercial solutions among professional services firms globally by region 2022
- Professional services industry's new technology adoption barriers 2020
- Global adoption of intelligent automation (IA) technologies in organizations 2019
- Italy: online publishers of advertising campaigns 2018, by channel
Further Content: You might find this interesting as well
Statistics
- Digital classifieds adoption among non-English users in India - by language 2016-2021
- Adoption rates of the Internet of Things (IoT) in the UK 2015, by industry
- AEB adoption in U.S. by brand MY 2016
- Worldwide 3D printing technology: current and intended acceptance by country, 2016
- Health and healthcare sector's new technology adoption barriers 2020
- Professional services industry's likely technology adoption rate 2020-2025
- Estimated adoption rates of Big Data in the UK 2020, by industry
- Online adoption readiness among non-English speakers in India - by language 2016
- Global 3D printing adoption rate by region, 2016 and 2021
- Adoption rate of telemedicine as of 2017, by provider type
- Colombia: financial inclusion index 2016-2017, by category
- Mining and metals industry's new technology adoption barriers 2020
- Adoption rates of Big Data collection in the UK 2015, by industry
- Adoption rate and likelihood of chatbots worldwide 2017
- Chile: financial inclusion index 2017, by category
- Use of commercial solutions among professional services firms globally by region 2022
- Professional services industry's new technology adoption barriers 2020
- Global adoption of intelligent automation (IA) technologies in organizations 2019
- Italy: online publishers of advertising campaigns 2018, by channel
Statista. (June 16, 2022). Adoption of header bidding worldwide in April 2021 and June 2022, by website traffic volume [Graph]. In Statista. Retrieved September 30, 2023, from https://www.statista.com/statistics/1227318/header-bidding-adoption-worldwide/
Statista. "Adoption of header bidding worldwide in April 2021 and June 2022, by website traffic volume." Chart. June 16, 2022. Statista. Accessed September 30, 2023. https://www.statista.com/statistics/1227318/header-bidding-adoption-worldwide/
Statista. (2022). Adoption of header bidding worldwide in April 2021 and June 2022, by website traffic volume. Statista. Statista Inc.. Accessed: September 30, 2023. https://www.statista.com/statistics/1227318/header-bidding-adoption-worldwide/
Statista. "Adoption of Header Bidding Worldwide in April 2021 and June 2022, by Website Traffic Volume." Statista, Statista Inc., 16 Jun 2022, https://www.statista.com/statistics/1227318/header-bidding-adoption-worldwide/
Statista, Adoption of header bidding worldwide in April 2021 and June 2022, by website traffic volume Statista, https://www.statista.com/statistics/1227318/header-bidding-adoption-worldwide/ (last visited September 30, 2023)
Adoption of header bidding worldwide in April 2021 and June 2022, by website traffic volume [Graph], Statista, June 16, 2022. [Online]. Available: https://www.statista.com/statistics/1227318/header-bidding-adoption-worldwide/