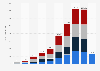
The BMW Group sold nearly 107,900 BMW-badged vehicles in the United States in the fourth quarter of 2023. Additionally, the Bavarian automaker sold around 10,700 MINI vehicles.
MINI and BMW feel the effects of the semiconductor shortage
The global automotive semiconductor shortage had been impacting the automotive sector through 2021 and 2022. Manufacturers contended with production losses, with decreased both unit sales and profits. In the U.S., the BMW Group was among those impacted. BMW annual sales decreased by around 1.53 percent year-over-year, while sales from its MINI subsidiary fell by over 16 percent. This contrasts with the growth MIN recorded in 2021, as it recovered from the COVID-19 pandemic. The British car brand was acquired by BMW in 2000, and worldwide sales of MINI vehicles peaked in 2017 at just over 370,000 units. However, MINI vehicles had a lesser appeal for American customers when compared to the manufacturer's namesake brand. U.S. consumer satisfaction was indeed higher for BMW, which was also the country's most popular luxury car brand.
BMW records a strong recovery from the pandemic
Globally, the luxury carmaker delivered encouraging 2021 financial results, successfully recovering from the dip in revenue reported in 2020 due to the COVID-19 pandemic. BMW generated revenue streams of about 111.2 billion euros, surpassing its 2019 revenue. It also produced EBIT (earnings before interest and taxes) of slightly 13.4 billion euros, a sharp increase of 80.81 percent compared to its 2019 EBIT. The luxury car brand was the fourth most valuable brand in the automotive sector as of June 2023 and ranked among the leading brands worldwide across sectors in 2023. Toyota and Mercedes-Benz were the only automotive brands higher in the global ranking.
BMW Group's vehicle sales in the United States between the 1st quarter of 2020 and 4th quarter of 2023, by segment
(in units)
Profit from the additional features of your individual account
Currently, you are using a shared account. To use individual functions (e.g., mark statistics as favourites, set
statistic alerts) please log in with your personal account.
If you are an admin, please authenticate by logging in again.
Learn more about how Statista can support your business.
GoodCarBadCar.net. (January 4, 2024). BMW Group's vehicle sales in the United States between the 1st quarter of 2020 and 4th quarter of 2023, by segment (in units) [Graph]. In Statista. Retrieved October 06, 2024, from https://www.statista.com/statistics/235106/bmw-groups-vehicle-sales-in-the-united-states-by-segment/
GoodCarBadCar.net. "BMW Group's vehicle sales in the United States between the 1st quarter of 2020 and 4th quarter of 2023, by segment (in units)." Chart. January 4, 2024. Statista. Accessed October 06, 2024. https://www.statista.com/statistics/235106/bmw-groups-vehicle-sales-in-the-united-states-by-segment/
GoodCarBadCar.net. (2024). BMW Group's vehicle sales in the United States between the 1st quarter of 2020 and 4th quarter of 2023, by segment (in units). Statista. Statista Inc.. Accessed: October 06, 2024. https://www.statista.com/statistics/235106/bmw-groups-vehicle-sales-in-the-united-states-by-segment/
GoodCarBadCar.net. "Bmw Group's Vehicle Sales in The United States between The 1st Quarter of 2020 and 4th Quarter of 2023, by Segment (in Units)." Statista, Statista Inc., 4 Jan 2024, https://www.statista.com/statistics/235106/bmw-groups-vehicle-sales-in-the-united-states-by-segment/
GoodCarBadCar.net, BMW Group's vehicle sales in the United States between the 1st quarter of 2020 and 4th quarter of 2023, by segment (in units) Statista, https://www.statista.com/statistics/235106/bmw-groups-vehicle-sales-in-the-united-states-by-segment/ (last visited October 06, 2024)
BMW Group's vehicle sales in the United States between the 1st quarter of 2020 and 4th quarter of 2023, by segment (in units) [Graph], GoodCarBadCar.net, January 4, 2024. [Online]. Available: https://www.statista.com/statistics/235106/bmw-groups-vehicle-sales-in-the-united-states-by-segment/