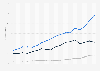
- Sports & Recreation›
- Sports & Fitness›
Revenue earned from sports merchandise by region worldwide 2009-2015
Total revenue generated from sports merchandising by region worldwide from 2009 to 2015 (in billion U.S. dollars)*

Latin America | Asia Pacific | Europe, Middle East and Africa | North America | |
---|---|---|---|---|
2009 | 0.42 | 2.29 | 2.25 | 12.63 |
2010 | 0.42 | 2.35 | 2.29 | 12.57 |
2011 | 0.43 | 2.43 | 2.23 | 12.48 |
2012 | 0.45 | 2.39 | 2.4 | 12.77 |
2013 | 0.46 | 2.46 | 2.36 | 13.28 |
2014 | 0.53 | 2.57 | 2.58 | 13.89 |
2015 | 0.5 | 2.76 | 2.54 | 14.26 |
© Statista 2019
About this statistic
Show source
Please be patient - this may take a moment
Description
Source
More information
- Show sources information
- Show publisher information
- Release date
- December 2011
- Region
- Worldwide
- Survey time period
- 2009 to 2015
- Supplementary notes
-
* The figures given for the years 2011 to 2015 represent forecasts.
The data have been rounded to provide better understanding of the statistics.
- Region
- Worldwide
- Survey time period
- 2009 to 2015
- Supplementary notes
-
* The figures given for the years 2011 to 2015 represent forecasts.
The data have been rounded to provide better understanding of the statistics.


You only have access to basic statistics.
- Instant access to 1m statistics
- Download in XLS, PDF & PNG format
- Detailed references
$49 / Month *
Corporate solution including all features.
Prices do not include sales tax.


I think of Statista as Google for researchers. Statista provides you with the information you search for right away.Dr. Horst Stipp
EVP, Research & Innovation, Advertising Research Foundation
- Participation
- Number of participants in skiing in the United States from 2007 to 2017 (in millions)*Participants in skiing in the U.S. 2007-2017
- Number of participants in snowboarding in the United States from 2007 to 2017 (in millions)Number of participants in snowboarding in the U.S. 2007-2017
- Number of participants in snowshoeing in the United States from 2007 to 2017 (in millions)Number of participants in snowshoeing in the U.S. 2007-2017
- Number of participants in U.S. high school alpine skiing from 2009/10 to 2017/18, by genderNumber of participants in U.S. high school alpine skiing 2017/18, by gender
- Number of participants in U.S. high school cross country skiing from 2009/10 to 2017/18, by genderNumber of participants in U.S. high school cross country skiing 2017/18, by gender
- Ski resorts & areas
- Ski equipment wholesale sales in the U.S. from 2007 to 2017 (in million U.S. dollars)*Wholesale sales of ski equipment in the U.S. 2007-2017
- Number of ski resorts operating in the U.S. from 1990/91 to 2017/18United States: number of ski resorts operating 2017/18
- Number of ski areas operating per state in the U.S. during the 2017/2018 seasonUnited States number of ski areas operating, per state 2017/18
- Estimated number of skier/snowboard visits in the U.S. from 2000/01 to 2017/18 (in millions)Number of snow sports (skier/snowboard) visits in the United States 2000-2018
- Number of ski areas in Europe in 2018, by countryEurope: number of ski areas in 2018, by country
- Number of people who ski in Europe as of 2018, by country (in 1,000)Europe: number of people who ski as of 2018, by country
- Ice hockey
- Countries by number of registered ice hockey players in 2017/18Countries ranked by number of ice hockey players 2017/18
- Countries by number of ice hockey rinks in 2017/18Countries ranked by number of ice hockey rinks 2017/18
- Ice hockey equipment wholesale sales in the U.S. from 2007 to 2017 (in million U.S. dollars)*Wholesale sales of ice hockey equipment in the U.S. 2007-2017
- Number of participants in ice hockey in the United States from 2006 to 2017 (in millions)*Participants in ice hockey in the U.S. from 2006 to 2017
- Total number of registered ice hockey players in the United States from 2010/11 to 2017/18Ice hockey players in the United States 2010-2018
- Number of participants in U.S. high school ice hockey from 2009/10 to 2017/18, by genderNumber of participants in U.S. high school ice hockey 2017/18, by gender
- Total number of ice hockey rinks in the United States from 2010/11 to 2017/18Ice hockey rinks in the United States 2010-2018
- Total number of registered ice hockey players in Canada from 2010/11 to 2017/18Ice hockey players in Canada 2010-2018
- Olympic Winter Games
- Olympic Winter Games global TV audience/viewership from 2010 to 2018 (in billions)*Global TV audience/viewership of Olympic Winter Games 2010-2018
- Number of Olympic Winter Games host broadcast feed hours from 1992 to 2014Olympic Winter Games: number of host broadcast feed hours 2014
- Revenue of the OCOGs domestic sponsorship programs for the Winter Games from 1998 to 2014 (in million U.S. dollars)Olympic Winter Games: revenue of the OCOGs sponsorship programs 2014
- Number of partners in the OCOGs sponsorship programs for the Winter Games from 1998 to 2014Olympic Winter Games - partners in the OCOGs domestic sponsorship programs 2014
- Tickets available and sold at the Olympic Winter Games from 1988 to 2018 (in millions)Olympic Winter Games: tickets available and sold 2018
- Total medal tally of the Winter Olympic Games by country from 1924 to 2018Winter Olympic Games total number of medals won by country 1924-2018
- Athletes at Winter Olympic Games with the most medals won from 1924 to 2018Winter Olympic Games - most successful medalists 1924-2018
- Revenue earned from sports merchandise worldwide 2006-2015
- Sports merchandise revenue in North America 2009-2022
- Percentage distribution of sports media rights revenue by region worldwide 2012
- Global sports market - projected compound annual growth rate 2011-2015
- Sports media rights total revenue worldwide 2015
- Global sports market - projected annual growth 2011-2015
- Global sports market by region - projected compound annual growth rate 2011-2015
- Sports broadcast media rights total revenue worldwide by region 2009-2013
- Sports media rights total revenue in North America 2006-2022
- England: number of physically active men and women 2018, by type of activity
- Sports sponsorship revenue worldwide by region 2015
- England: share of live sports events spectators 2018, by ethnicity
- Sports events market revenue worldwide by region/sport 2013
- England: number of live sports events spectators 2018, by age
- England: number of live sports events spectators 2018, by ethnicity
- Total revenue sports market worldwide 2005-2017
- Percentage distribution of global sports revenue by component 2011
- England: number of live sports events spectators 2018, by region
- Sports cards by selling price 2014
- Sports on TV in the U.S.
- Sports brands
- Equestrian Sports in the United Kingdom (UK)
- Sport club memberships in the United Kingdom (UK)
- Sport Associations in the United Kingdom (UK)
- At the gate and beyond 2018
- Sport in Scotland (UK)
- Rugby in the United Kingdom (UK)
- Sport in Northern Ireland
- Professional football in the Nordic countries
- At the gate and beyond 2017
- 2018 Olympic Sports Social Media Ranking
- Football sponsorship in Europe
- Changing the game 2011
- The Future of Sports 2015
- Number of participants in U.S. high school alpine skiing from 2009/10 to 2017/18, by gender
- Number of participants in U.S. high school cross country skiing from 2009/10 to 2017/18, by gender
- Number of ski areas operating per state in the U.S. during the 2017/2018 season
- Estimated number of skier/snowboard visits in the U.S. from 2000/01 to 2017/18 (in millions)
- Number of ski areas in Europe in 2018, by country
- Countries by number of registered ice hockey players in 2017/18
- Countries by number of ice hockey rinks in 2017/18
- Total number of registered ice hockey players in the United States from 2010/11 to 2017/18
- Number of participants in U.S. high school ice hockey from 2009/10 to 2017/18, by gender
- Total number of ice hockey rinks in the United States from 2010/11 to 2017/18
- Total number of registered ice hockey players in Canada from 2010/11 to 2017/18
- Total number of ice hockey rinks in Canada from 2010/11 to 2017/18
- Medal count of the men's ice hockey world championship from 1920 to 2018
- Olympic Winter Games global TV audience/viewership from 2010 to 2018 (in billions)*
- Number of partners in the OCOGs sponsorship programs for the Winter Games from 1998 to 2014
- Tickets available and sold at the Olympic Winter Games from 1988 to 2018 (in millions)
- Total medal tally of the Winter Olympic Games by country from 1924 to 2018
- Athletes at Winter Olympic Games with the most medals won from 1924 to 2018
- Total revenue generated from sports merchandising worldwide from 2006 to 2015 (in billion U.S. dollars)*
- Sports merchandising market size in North America from 2009 to 2022 (in billion U.S. dollars)*
- Regional share of sports media rights revenue from 2009 to 2012*
- Projected compound annual growth rate of the global sports market from 2011 to 2015, by market segment
- Global revenue earned from sports media rights from 2006 to 2015 (in billion U.S. dollars)*
- Projected annual growth of the global sports market from 2011 to 2015
- Projected compound annual growth rate of the global sports market by region from 2011 to 2015*
- Global revenue earned from sports broadcast media rights by region from 2009 to 2013 (in billion U.S. dollars)*
- Total revenue from sports sponsorship worldwide by geographical region from 2009 to 2015 (in billion U.S. dollars)*
- Global sports market - total revenue from 2005 to 2017 (in billion U.S. dollars)
- Global sports market revenue distribution by component from 2009 to 2011
- Number of participants in skiing in the United States from 2007 to 2017 (in millions)*
- Number of participants in snowboarding in the United States from 2007 to 2017 (in millions)
- Number of participants in snowshoeing in the United States from 2007 to 2017 (in millions)
- Ski equipment wholesale sales in the U.S. from 2007 to 2017 (in million U.S. dollars)*
- Number of ski resorts operating in the U.S. from 1990/91 to 2017/18
- Number of people who ski in Europe as of 2018, by country (in 1,000)
- Ice hockey equipment wholesale sales in the U.S. from 2007 to 2017 (in million U.S. dollars)*
- Number of participants in ice hockey in the United States from 2006 to 2017 (in millions)*
- Number of Olympic Winter Games host broadcast feed hours from 1992 to 2014
- Revenue of the OCOGs domestic sponsorship programs for the Winter Games from 1998 to 2014 (in million U.S. dollars)
- Sports media rights market size in North America from 2006 to 2022 (in billion U.S. dollars)*
- Number of men and women who are physically active for more than 150 minutes a week in England from May 2017 to May 2018, by type of activity
- Share of people who have attended at least two live sports events in the last year in England from May 2017 to May 2018, by ethnicity
- Global sporting events market revenue by region and sport in 2013 (in billion U.S. dollars)
- Number of people who have attended at least two live sports events in the last year in England from May 2017 to May 2018, by age
- Number of people who have attended at least two live sports events in the last year in England from May 2017 to May 2018, by ethnicity
- Number of people who have attended at least two live sports events in the last year in England from May 2017 to May 2018, by region
- Sports cards with the highest selling price as of October 2014 (in U.S. dollars)
Statista offers dossiers and reports on over 170 industries. With Statista you are always able to make informed decisions and boost your work efficiency.
Internet & Telecommunications
- Social Media
- E-Commerce
- Online Video & Entertainment
- Advertising & Marketing
Consumer Goods & FMCG
- Alcoholic Beverages
- Cleaning Products
- Cosmetics & Personal Care
- Food & Nutrition
Retail & Trade
- Health & Hygiene
- International Trade
- Shopping Behavior
- Sports & Leisure
Travel, Tourism & Hospitality
- Business Travel
- Leisure Travel
- Accomodation
- Restaurants
Society
- Demographics
- Economy
- Education & Science
- Politics & Government
Transportation & Logistics
- Aviation
- Rail Transport
- Vehicles & Road Traffic
- Water Transport
Register in seconds and access exclusive features.
Basic Account |
Instant Access
Premium Account | ||
---|---|---|---|
Our servicesClick the question mark for further information | Free |
$49 per month* | |
Basic statistics | |||
Premium statistics | |||
Graph download
| |||
Download PDF | |||
Excel download
| |||
Register | Purchase now |
This feature is limited to our corporate solutions.
Please contact us to get started with full access to dossiers, forecasts, studies and international data.

Updates on eCommerce, Digital Media, eTravel, eServices and more
- Market figures for 2018 to 2023
- Company and startup profiles
- User demographics

U.S. coal production has steadily declined in the past decade, but has been in the news in recent years due to President Trump's desire to revitalize the industry. This document provides an overview of the key figures, leading companies, and the employment trends in the U.S. coal mining industry.

This new export feature offers
- Structured graphical representation of the data
- Tailored target group analysis
- Option for further processing

The Polish e-commerce market is one of the fastest developing e-commerce markets in Europe. The latest data for Poland is presented in this dossier.

Plastic waste is an issue of global concern. Since China banned the import of recycled plastic, the U.S. has had to make adjustments to its management of plastic waste. This dossier provides an overview of plastic waste in the U.S.

This dossier provides an overview of hedge funds worldwide. Global hedge fund assets, performance, investors, and other topics are highlighted.

The Outdoor Advertising Association of America covers amongst others
- Number of billboards
- Outdoor advertising revenue
- Number of out-of-home displays

Find data, perceptions & more about
- Economic consequences
- Impact on the labor market
- A second referendum

Understand the recent developments in the Spanish eCommerce market!
- URL-related revenues
- Relevant online store KPIs
- eCommerce-related contacts

- Extended statistical dossier
- Insights, explanations & interpretations
- Challenges of the digital future

eCommerce is rapidly becoming a part of the Latin American shopping culture. The dossier includes data on
- Regional online shopping events
- Events by country

The outline of potential impacts of Brexit on UK industries has been updated in the UK Industry Reports.

Italian enterprises invest significantly in digital marketing. Find out about
- Relevant aspects & KPIs
- New trends
- Different strategies

Statista European Football Benchmark
- The big 5 European leagues
- All about the clubs & fans
- Sponsors & how they fit in

What are online shoppers' payment preferences around the world?
- Data on all payment methods
- Analysis for 50 countries
- Forecasts up to 2023

The kingdom of Saudi Arabia has faced political challenges.
- Perceptions & trade information
- Conflicts with Yemen, Iran, Qatar & Turkey
We use cookies to personalize contents and ads, offer social media features, and analyze access to our website. In your browser settings you can configure or disable this, respectively, and can delete any already placed cookies. For details, please see your browser’s Help section (by pressing F1). Please see our privacy statement for details about how we use data.