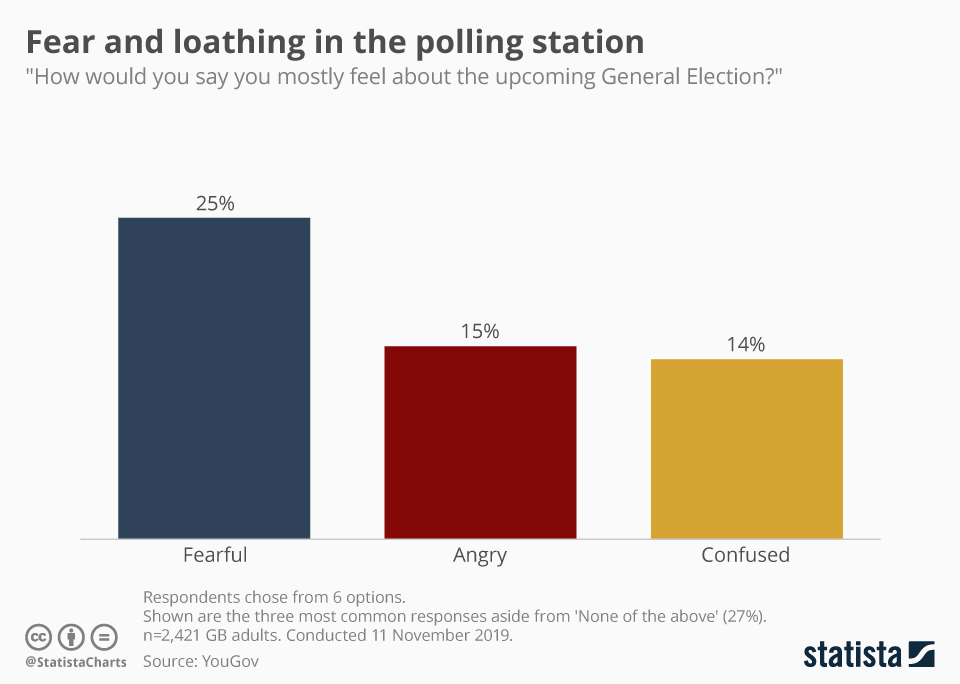
A new survey by YouGov has revealed the overriding feeling going into this December's general election is one of fear. When asked how they mostly feel about the upcoming vote, from the six options ranging from Excited (5 percent) to Angry, Fearful was chosen by a quarter of respondents. The other positive options of Enthusiastic (7 percent) and Proud (1 percent) also garnered little interest, giving way - fitting to the times - to anger and confusion.
Advertisement
Advertisement
Advertisement
Related Infographics
FAQ
- The Statista "Chart of the Day", made available under the Creative Commons License CC BY-ND 3.0, may be used and displayed without charge by all commercial and non-commercial websites. Use is, however, only permitted with proper attribution to Statista. When publishing one of these graphics, please include a backlink to the respective infographic URL. More Information
- The Statista "Chart of the Day" currently focuses on two sectors: "Media and Technology", updated daily and featuring the latest statistics from the media, internet, telecommunications and consumer electronics industries; and "Economy and Society", which current data from the United States and around the world relating to economic and political issues as well as sports and entertainment.
- For individual content and infographics in your Corporate Design, please visit our agency website www.statista.design
Any more questions?
Get in touch with us quickly and easily.
We are happy to help!
Do you still have questions?
Feel free to contact us anytime using our contact form or visit our FAQ page.
Your contact to the Infographics Newsroom


Statista Content & Design
Need infographics, animated videos, presentations, data research or social media charts?
Advertisement