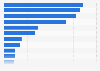
The smartphone has become one of our most reliable and constant companions over the last few years, eating up more an more significant chunks of our time. So what are we doing the whole time with this compact piece of technology? According to research by AudienceProject, the largest share of smartphone users in the United States say social media apps take up most of their screen time, followed by browsers and email apps. Respondents were able to name up to three app types which they spend the most time on.
Apps
The Apps Taking Up the Most of Our Time


Description
This chart shows the share of U.S. smartphone users saying they spend the most time on the following app types.