Skip to main content
Consumer Goods & FMCG
E-Commerce
Economy & Politics
Energy & Environment
Health, Pharma & Medtech
Internet
Media
Technology & Telecommunications
Transportation & Logistics
Travel, Tourism & Hospitality
View all industries
Global data volume growth
Global AI market size
Number of generative AI users worldwide
Global inflation rate
Retail e-commerce sales worldwide
Largest economies worldwide
Biggest social media platforms by users
Global EV market share by manufacturer
International tourist arrivals by world region
Global annual CO₂ emissions
Browse recent statistics
Artificial intelligence (AI) worldwide
TikTok
Nvidia
E-commerce worldwide
Global GDP
Instagram
Apparel market worldwide
Video gaming worldwide
Global renewable energy industry
Influencer marketing worldwide
Browse recent topics
Consumer Trends 2026
Artificial Intelligence: in-depth market analysis
E-commerce challenges
Global economy
TikTok
Luxury goods: in-depth market analysis
Electric vehicles: A global overview
Video gaming worldwide
Travel and tourism trends 2026
Battery recycling worldwide
Browse recent reports
Explore the tool
Explore Classic mode
Advertising & Media
eCommerce
Consumer
Finance
Global Indicators
Health
Industrial
Mobility
Technology
Explore Market Insights
eCommerce Insights
Research AI
Book a demo
All integrations
Developer docs
Explore Statista Connect
Research
Strategy & Consulting
Marketing
Media & PR
Explore AI assistants
Marketing
Research & Development
Strategy
Sales
Find the fact
Tell the story
Win the pitch
Understand the market
Develop your strategy
Academia
Agencies
Consultancies
Consumer goods
Finance
Tech
Research solutions
Strategy consulting
Communication services
Explore Statista+
Statista R
Statista Healthcare
About Statista
First steps & help center
Webinar & training hub
Success stories
Individuals & Small Teams
Businesses & Enterprises
Academia & Government
English
Deutsch
Daily Data
Infographics on the topic "+"
BYD
Jan 5, 2026
This chart shows global passenger car sales of Chinese automaker BYD.
More Information
Tesla vs. BYD
Jan 5, 2026
This chart shows annual sales of electric vehicles by market leaders Tesla and BYD.
More Information
U.S. President Donald Trump
Jan 5, 2026
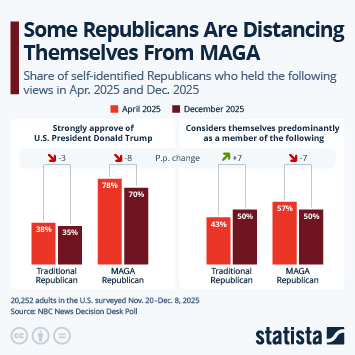
This chart shows the share of self-identified Republicans who held the following views in Apr. 2025 and Dec. 2025.
More Information
Venezuela
Jan 5, 2026
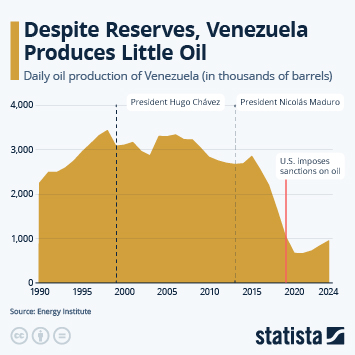
This infographic shows the daily oil production of Venezuela by year, in thousands of barrels.
More Information
Immigration
Jan 5, 2026
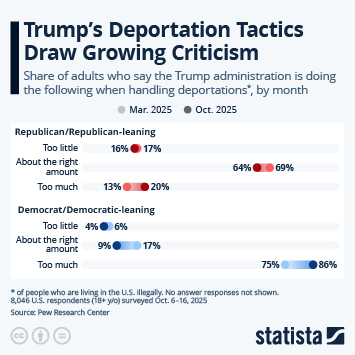
This chart shows share of adults who say the Trump administration is doing the following when handling deportations, by month.
More Information
Fossil fuel reserves
Jan 5, 2026
This chart shows the countries with the largest proven crude oil reserves.
More Information
Sponsored post by Booking.com
Jan 2, 2026
This infographic shows the number of people directly employed in the Australian tourism sector in 2024
More Information
Happy Holidays!
Dec 23, 2025
Happy Holidays! We'll be back on January 5, 2026.
More Information
Snowfall
Dec 23, 2025
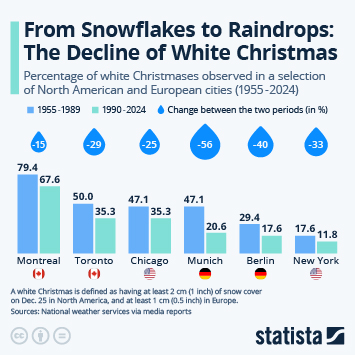
This infographic shows the percentage of white Christmases observed in a selection of North American and European cities (1955-2024).
More Information
2026 global predictions
Dec 22, 2025
This chart shows the share of global respondents that are optimistic that next year will be better than the last.
More Information
Entertainment
Dec 19, 2025
This chart shows worldwide box office earnings of the highest-grossing movies of all time.
More Information
Movie Industry
Dec 19, 2025
This chart shows annual box office earnings and ticket sales in North America since 2000.
More Information
Holiday Traditions
Dec 19, 2025
This chart shows which traditions Americans consider essential parts of the holiday season.
More Information
Travel ban
Dec 19, 2025
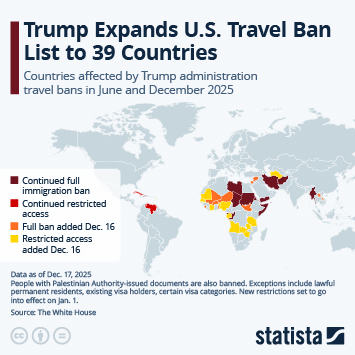
This chart shows the countries affected by Trump administration travel bans in June and December 2025.
More Information
Sponsored post by Booking.com
Dec 19, 2025
This infographic shows the share of Japanese hoteliers who consider AI helpful for their accommodation businesses.
More Information
Internal displacement
Dec 18, 2025
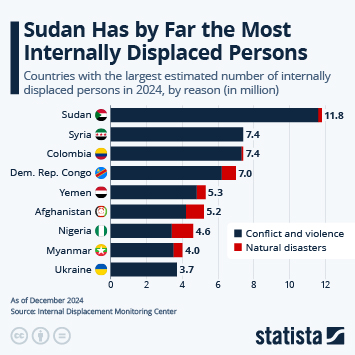
This chart shows the countries with the largest estimated number of internally displaced persons in 2024, by reason (in million).
More Information
Refugee crisis
Dec 18, 2025
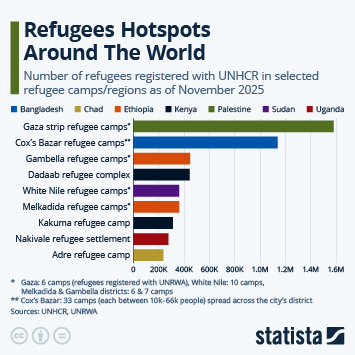
This infographic shows the number of refugees registered with UNHCR in selected refugee camps/settlement areas as of November 2025.
More Information
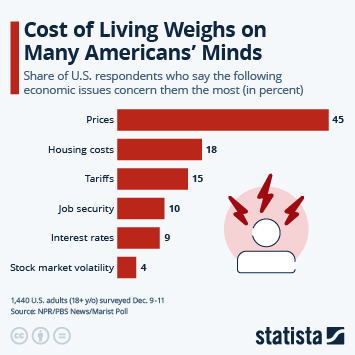
Affordability crisis
Dec 18, 2025
Share of U.S. respondents who say the following economic issues concern them the most (in percent)
More Information
Christmas
Dec 18, 2025
This chart shows the share of respondents who say it's likely that they will receive a Christmas bonus this year, by country (in %).
More Information
Alcohol
Dec 17, 2025
This chart shows the biggest champagne importers worldwide in 2024.
More Information
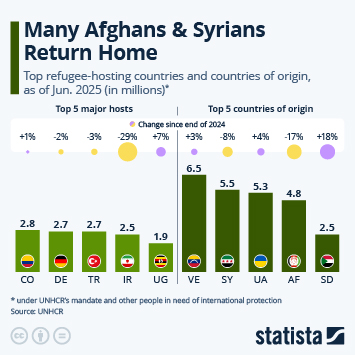
International Migrants Day
Dec 17, 2025
This chart shows the top refugee-hosting countries and countries of origin, as of June 2025 (in millions).
More Information
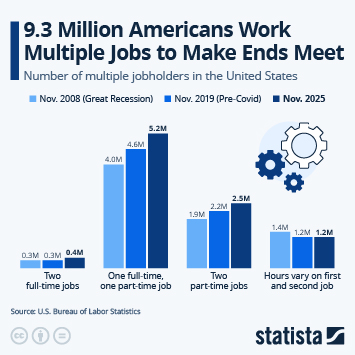
U.S. Labor Market
Dec 17, 2025
This chart shows the number of Americans working multiple jobs.
More Information
Sponsored post by Booking.com
Dec 17, 2025
This infographic illustrates the supply and demand for jobs in the Japanese hotel industry.
More Information
New Year's Resolutions
Dec 16, 2025
This chart shows the most common New Year's resolutions among U.S. respondents who have made one or several (2025).
More Information
Food Trade
Dec 16, 2025
This chart shows the main food products exported and imported by the United States in 2024 (in billion U.S. dollars).
More Information
Food Safety
Dec 16, 2025
This chart shows a selection of substances which are banned/restricted for food use in the EU, by status (as of Dec. 2025).
More Information
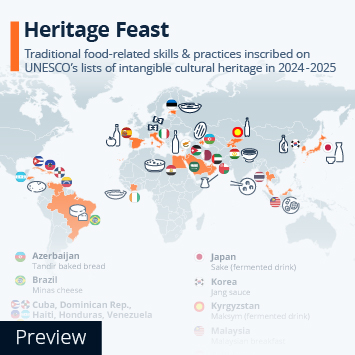
Food Culture
Dec 16, 2025
The map shows the traditional food-related skills & practices inscribed on UNESCO’s lists of intangible cultural heritage in 2024-2025.
More Information
Christmas
Dec 16, 2025
This chart shows the share of adults saying they will put up a Christmas tree in 2025, by type - artificial or real.
More Information
Tourism recovery after Covid-19
Dec 15, 2025
This chart shows international tourist arrivals worldwide since 1990.
More Information
Airline Industry
Dec 15, 2025
This chart shows the estimated total net profit/loss of the global airline industry.
More Information
Travel & Tourism
Dec 15, 2025
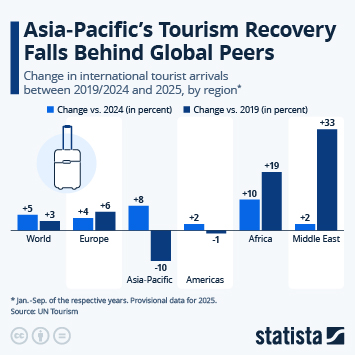
This chart shows the change in international arrivals between 2019/24 and 2025, by region.
More Information
China Trade
Dec 15, 2025
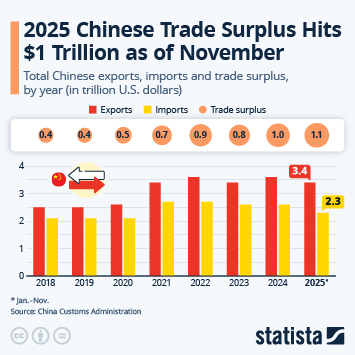
This chart shows total Chinese exports, imports and trade surplus, by year.
More Information
Sponsored post by Booking.com
Dec 15, 2025
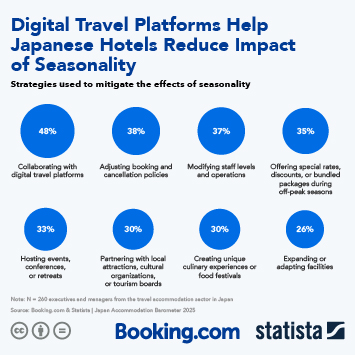
This infographic shows the strategies used by hoteliers in Japan to mitigate the effects of seasonality.
More Information
China Trade
Dec 12, 2025
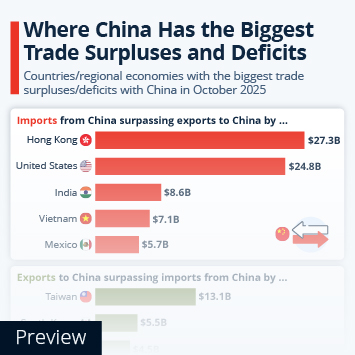
This chart shows countries/regional economies with the biggest trade surpluses/deficits with China in October 2025.
More Information
Drug Trafficking
Dec 12, 2025
This chart shows the coca leaf-producing countries worldwide and cocaine users by region.
More Information
Immigration
Dec 12, 2025
This chart shows countries with residence-by-investment or similar schemes (as of August 2025).
More Information
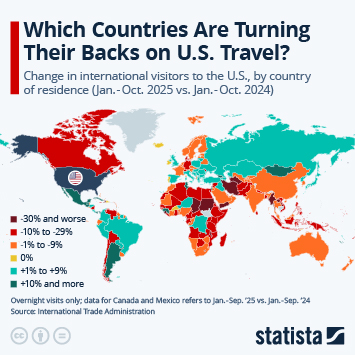
U.S. Travel
Dec 12, 2025
This chart shows the change in international overnight visitors to the United States in the first 10 months of 2025 compared to the...
More Information
U.S. travel
Dec 12, 2025
This chart shows the total border searches of international travelers' electronic devices at U.S. ports of entry.
More Information
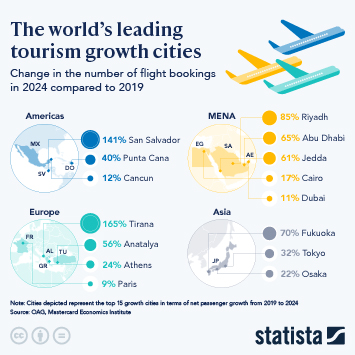
Sponsored post by Booking.com
Dec 12, 2025
This infographic shows the change in number of flight bookings in 2024 compared to 2019.
More Information
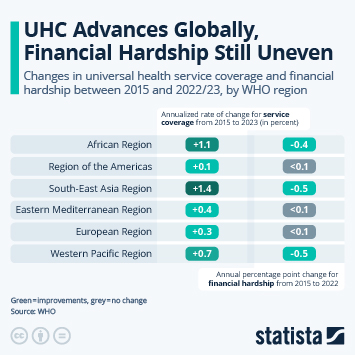
Universal Health Coverage Day
Dec 11, 2025
This chart shows the changes in universal health service coverage and financial hardship between 2015 and 2022/23, by WHO region.
More Information
International Universal Health Coverage Day
Dec 11, 2025
This chart shows the UHC service coverage index in 2023 by country.
More Information
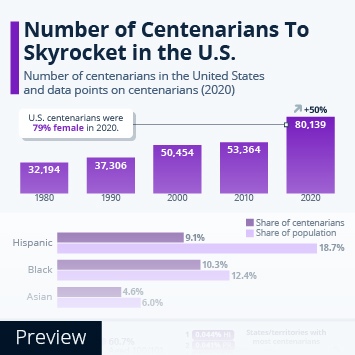
Old Age
Dec 11, 2025
This chart shows the number of centenarians in the United States and data points on centenarians (2020).
More Information
Aviation industry
Dec 10, 2025
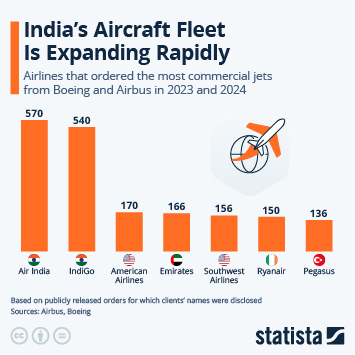
This chart shows the airlines that ordered the most commercial jets from Boeing and Airbus in 2023 and 2024.
More Information
Air Travel
Dec 10, 2025
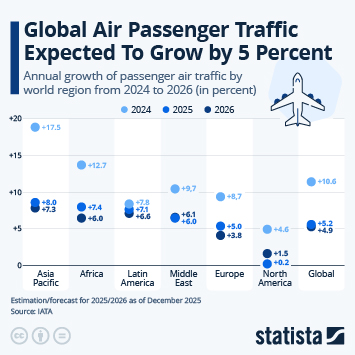
This chart shows the annual growth of passenger air traffic by world region from 2024 to 2026 (in percent).
More Information
Venezuela
Dec 10, 2025
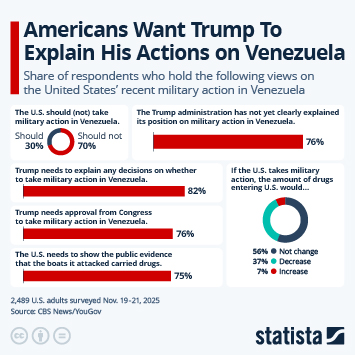
This chart shows the share of respondents who hold various views on the United States' recent military action in Venezuela.
More Information
Pilot shortage
Dec 10, 2025
This chart compares the number of pilots/co-pilots employed and the size of aircraft fleet in service for selected major airlines.
More Information
Venezuela
Dec 10, 2025
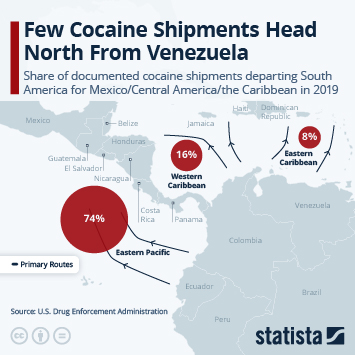
This chart shows the share of documented cocaine shipments departing South America for Mexico/Central America/the Caribbean in 2019.
More Information
Netflix Buys Warner Bros.
Dec 8, 2025
This chart shows a selection of the movie and TV franchises that Netflix will own after the acquisition of Warner Bros.
More Information
Netflix
Dec 8, 2025
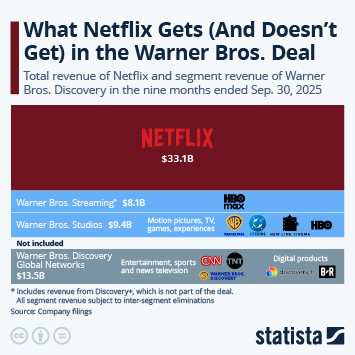
This chart sums up components of the Netflix-Warner Bros. deal announced in December 2025.
More Information
TV
Dec 8, 2025
This chart shows the share of respondents who watch TV for at least 11 hours per week in selected countries.
More Information
Service Robots
Dec 8, 2025
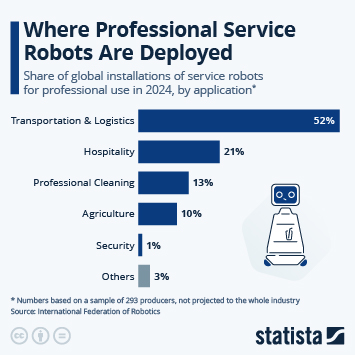
This chart shows the main applications of professional service robots.
More Information
AI Investments
Dec 8, 2025
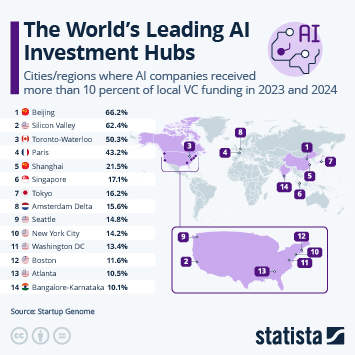
This map shows the cities/regions where AI companies received more than 10 percent of local venture capital funding in 2023 and 2024.
More Information
Sponsored post by Booking.com
Dec 8, 2025
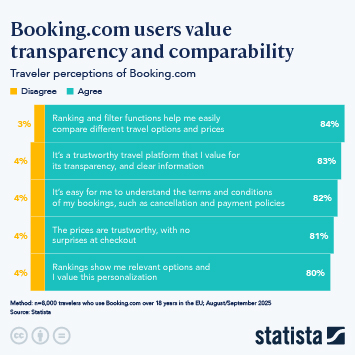
This infographic shows traveler responses to selected statements about Booking.com.
More Information
TV Consumption
Dec 8, 2025
This chart breaks down the total usage of television in the U.S. in September 2025, by delivery platform.
More Information
Iran
Dec 5, 2025
This chart shows Iran's stockpile of enriched uranium by quarter.
More Information
Middle East
Dec 5, 2025
This chart shows Iran's real GDP growth and inflation rate since 2010.
More Information
Human rights in Iran
Dec 5, 2025
This chart shows the number of recorded executions in Iran, by year.
More Information
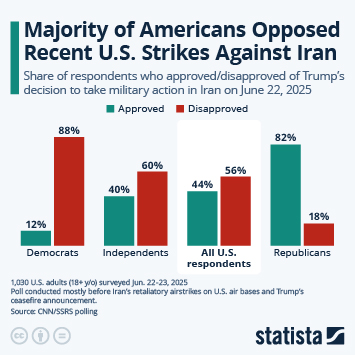
US-Iran relations
Dec 5, 2025
This chart shows the share of respondents who approved/disapproved of Trump's decision to take military action in Iran on June 22,...
More Information
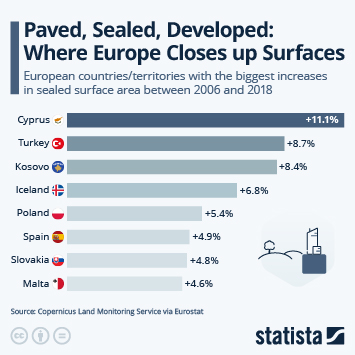
Surface Sealing
Dec 5, 2025
This chart shows the European countries/territories with the biggest increases in sealed surface area between 2006 and 2018.
More Information
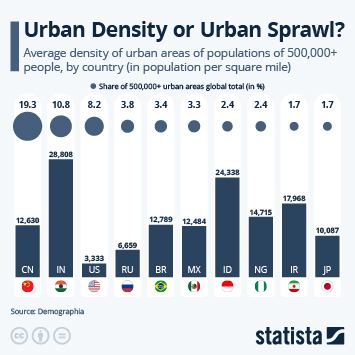
Soil Sealing
Dec 5, 2025
This chart shows the average density of urban areas of populations of 500,000+ people, by country (in population per square mile).
More Information
Travel
Dec 5, 2025
This chart shows the share of U.S. respondents who took the following trips in the past 12 months.
More Information
New Year's Eve
Dec 5, 2025
This chart shows the share of respondents who say that firworks and firecrackers are an essential part of a New Year's celebration.
More Information
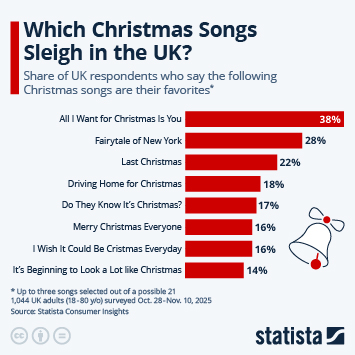
Christmas songs
Dec 4, 2025
This chart shows the share of UK respondents who say the following Christmas songs are their favorites.
More Information
Tax
Dec 4, 2025
This chart shows the Corporate Tax Haven Index score of the world's most damaging corporate tax havens in 2025.
More Information
Society
Dec 4, 2025
This chart shows global landmine contamination statuses as of 2025.
More Information
Conflicts
Dec 4, 2025
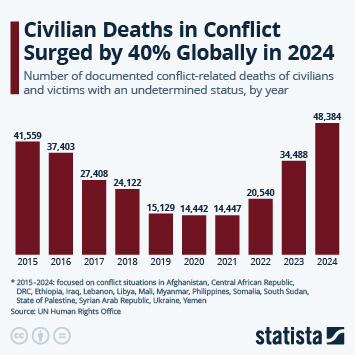
This chart shows the number of documented conflict-related deaths of civilians and victims with an undetermined status, by year.
More Information
Household debt
Dec 4, 2025
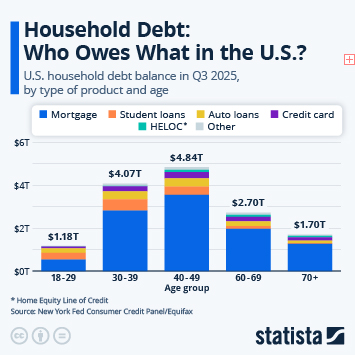
This chart shows U.S. household debt in Q3 2025 by age group and type of debt.
More Information
Defense
Dec 3, 2025
This chart shows the largest arms-producing companies in 2024.
More Information
India Labor Laws
Dec 3, 2025
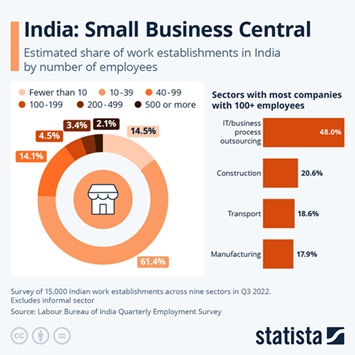
This charts shows the estimated share of work establishments in India by number of employees (in percent).
More Information
India Labor Laws
Dec 3, 2025
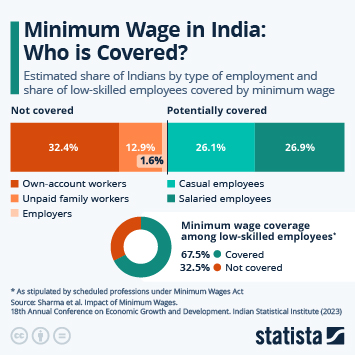
This chart shows the share of Indians by type of employment and share of low-skilled employees covered by minimum wage.
More Information
Defense
Dec 3, 2025
This map shows an overview of compulsory/voluntary military service in force or planned in European countries (as of Nov. 2025).
More Information
Poverty
Dec 3, 2025
This chart shows the share of respondents from selected countries who think that poverty is among the main issues in their country...
More Information
Conflict
Dec 3, 2025
This chart shows the global number of mine/ERW casualties per year.
More Information
Personal Finances
Dec 2, 2025
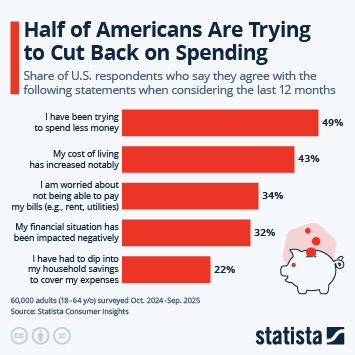
This chart shows the share of U.S. respondents who say they agree with a selection of statements when considering the last 12 months.
More Information
Immigration
Dec 2, 2025
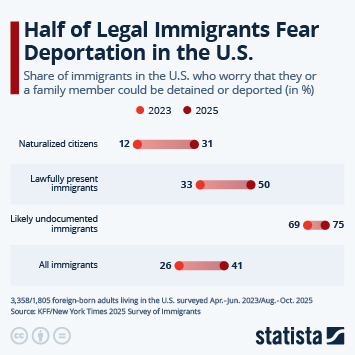
This infographic shows the evolution of the share of immigrants to the U.S. who fear deportation or arrest.
More Information
Criminal Justice System
Dec 2, 2025
This chart shows the rise in the number of incarcerated women in the U.S.
More Information
Global Prison System
Dec 2, 2025
This chart shows the national prison population by 100,000 residents.
More Information
Asylum Seekers in the U.S.
Dec 1, 2025
This chart shows asylum grants in the U.S. to the ten most common nationalities in FY 2024.
More Information
Living conditions
Dec 1, 2025
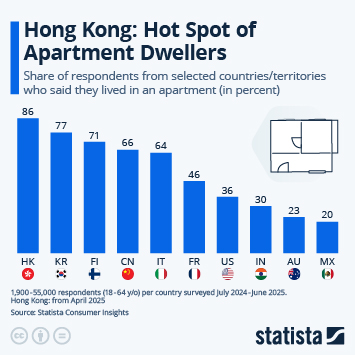
This chart shows the share of respondents from selected countries/territories who said they lived in an apartment (in percent).
More Information
Construction
Dec 1, 2025
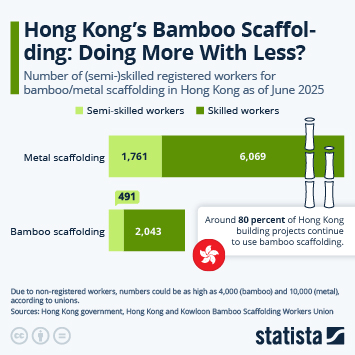
This chart shows the number of (semi-)skilled registered workers for bamboo/metal scaffolding in Hong Kong as of June 2025.
More Information
World AIDS Day
Dec 1, 2025
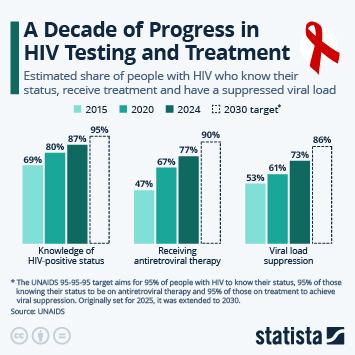
This chart illustrates the global progress in HIV testing and treatment rates since 2015.
More Information
Giving Tuesday
Dec 1, 2025
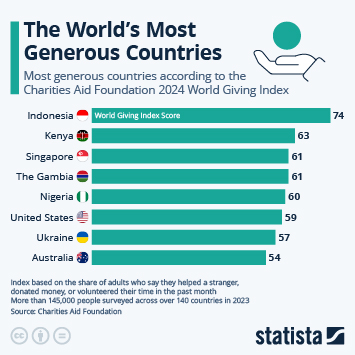
This infographic shows the world's most generous countries according to the Charities Aid Foundation 2024 World Giving Index.
More Information
Sponsored post by Booking.com
Dec 1, 2025
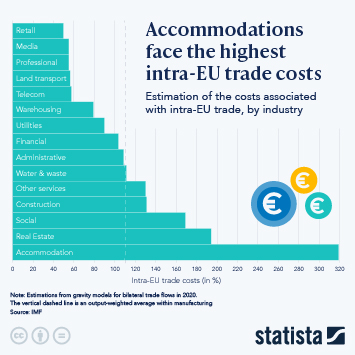
This infographic shows an estimation of the costs associated with intra-EU trade, by industry.
More Information
AI Risks
Nov 28, 2025
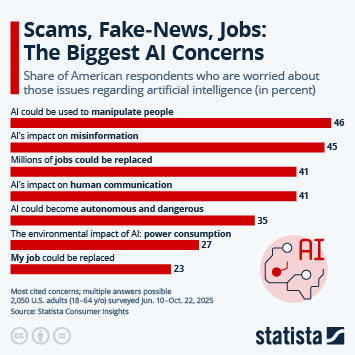
This chart shows the share of American respondents who are worried about those issues regarding artificial intelligence (in percent).
More Information
Chatbots
Nov 28, 2025
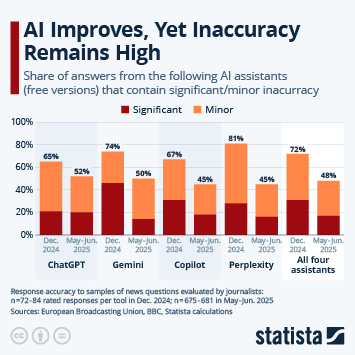
This chart shows the share of answers from the following AI assistants (free versions) that contain significant/minor inacurracy (in...
More Information
AI Tools
Nov 28, 2025
This chart shows the share of U.S. respondents who have tried different AI tools.
More Information
Pensions
Nov 28, 2025
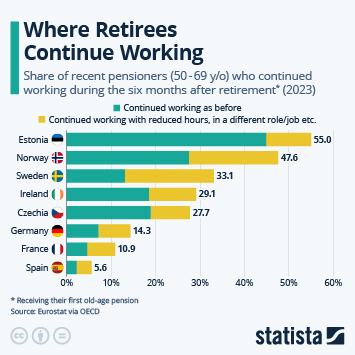
This chart shows the share of recent pensioners (50-69 y/o) who continued working during the six months after retirement (2023).
More Information
Dating Apps
Nov 28, 2025
This chart shows the most popular dating apps among U.S. users.
More Information
Fertility
Nov 28, 2025
This chart shows the actual and historically projected OECD-average fertility rates (lifetime births per woman).
More Information
HIV/AIDS
Nov 27, 2025
This chart shows the estimated number of AIDS-related deaths worldwide from 1990 to 2024.
More Information
12
/
161
Contact
Get in touch with us. We are happy to help.
Do you still have questions?
Feel free to contact us anytime using our
contact form
or visit our
FAQ page
.
Your contact to the Infographics Newsroom
Felix Richter
Data Journalist
felix.richter@statista.com
+49 (40) 284 841 557