Skip to main content
Consumer Goods & FMCG
E-Commerce
Economy & Politics
Energy & Environment
Health, Pharma & Medtech
Internet
Media
Technology & Telecommunications
Transportation & Logistics
Travel, Tourism & Hospitality
View all industries
Global data volume growth
Global AI market size
Number of generative AI users worldwide
Global inflation rate
Retail e-commerce sales worldwide
Largest economies worldwide
Biggest social media platforms by users
Global EV market share by manufacturer
International tourist arrivals by world region
Global annual CO₂ emissions
Browse recent statistics
Artificial intelligence (AI) worldwide
TikTok
Nvidia
E-commerce worldwide
Global GDP
Instagram
Apparel market worldwide
Video gaming worldwide
Global renewable energy industry
Influencer marketing worldwide
Browse recent topics
Consumer Trends 2026
Artificial Intelligence: in-depth market analysis
E-commerce challenges
Global economy
TikTok
Luxury goods: in-depth market analysis
Electric vehicles: A global overview
Video gaming worldwide
Travel and tourism trends 2026
Battery recycling worldwide
Browse recent reports
Explore the tool
Explore Classic mode
Advertising & Media
eCommerce
Consumer
Finance
Global Indicators
Health
Industrial
Mobility
Technology
Explore Market Insights
eCommerce Insights
Research AI
Book a demo
All integrations
Developer docs
Explore Statista Connect
Research
Strategy & Consulting
Marketing
Media & PR
Explore AI assistants
Marketing
Research & Development
Strategy
Sales
Find the fact
Tell the story
Win the pitch
Understand the market
Develop your strategy
Academia
Agencies
Consultancies
Consumer goods
Finance
Tech
Research solutions
Strategy consulting
Communication services
Explore Statista+
Statista R
Statista Healthcare
About Statista
First steps & help center
Webinar & training hub
Success stories
Individuals & Small Teams
Businesses & Enterprises
Academia & Government
English
Deutsch
Daily Data
Global stories vividly visualized
Russia
Oct 29, 2018
This chart shows liters of pure alcohol consumed per capita in Russia by beverage.
More Information
Celebrities
Oct 26, 2018
This chart shows the earnings of television actresses (June 1 2017-June 1, 2018)
More Information
Twitter
Oct 26, 2018
This chart shows Twitter's revenue and user growth.
More Information
Employment
Oct 26, 2018
This chart shows the gender pay gap for median gross hourly earnings of full-time employees in the UK, by age group.
More Information
Terror Incident
Oct 26, 2018
This chart maps the places and people targeted by pipe bombs.
More Information
Plastic Pollution
Oct 25, 2018
This chart shows the estimated number of years for selected items to bio-degrade in a marine environment.
More Information
Referendum
Oct 25, 2018
This chart shows the voting intention for the blasphemy referendum in Ireland in 2018.
More Information
U.S. Air Force
Oct 25, 2018
This chart shows mission capable rates of selected U.S. Air Force platforms.
More Information
Gender
Oct 25, 2018
Share of adults that cook and/or do housework in selected European countries, by gender in 2016.
More Information
Wireless carriers
Oct 24, 2018
This chart shows the market share of wireless carriers across India in 2016 and 2018, by company.
More Information
Media
Oct 24, 2018
This chart reveals the main reason people in Australia are now listening to more podcasts.
More Information
Home Entertainment
Oct 24, 2018
This chart shows consumer spending on home entertainment in the United States from 1999 to 2017.
More Information
Senate Race
Oct 24, 2018
This chart shows the2018 approval ratings among select U.S. senators.
More Information
Buying Behavior
Oct 24, 2018
This chart shows the percentage of consumers whose purchase decisions are influenced by their beliefs.
More Information
Japan
Oct 24, 2018
This chart shows the share of the Japanese wearables market in 2017 by company.
More Information
United Kingdom
Oct 24, 2018
This chart shows how likely people in the UK feel a second referendum on the country's EU membership is.
More Information
Autonomous Vehicles
Oct 24, 2018
This chart shows index scores on the level of preparedness for driverless cars in 2018.
More Information
Migrant Caravan
Oct 24, 2018
This chart shows the population density in Honduras from 1990 to 2017 as well as the poverty and murder rates.
More Information
Cybercrime
Oct 23, 2018
This chart shows the types of cybercrimes most frequently reported to the IC3 in 2017.
More Information
China
Oct 23, 2018
This chart shows NIO ES8 delivery volume from June to September 2018.
More Information
Household Wealth
Oct 23, 2018
This chart shows total household wealth by region in 2018 and % change since 2017 (in billion U.S. dollars).
More Information
Defense
Oct 22, 2018
This chart shows the value of arms imported to Saudi Arabia between 2015 and 2017, by origin country.
More Information
Streaming vs. TV
Oct 22, 2018
This chart shows how video streaming services and TV compare in terms of customer satisfaction.
More Information
Russia
Oct 22, 2018
Share of Russians that approve of the job President Putin is doing from January 2016 to September 2018.
More Information
Generation X
Oct 22, 2018
This chart shows what influences purchase decisions of Americans born between 1965 and 1981.
More Information
Measles
Oct 22, 2018
This chart shows measles cases in Europe from January to August 2018.
More Information
Midterms
Oct 22, 2018
This chart shows likes, comments and shares on social media over the 30 days ending October 15.
More Information
Tech Industry
Oct 19, 2018
This chart shows the percentage of people agreeing that digital technology will help solve the world's most pressing challenges.
More Information
Apps
Oct 19, 2018
This chart shows the total revenue of the biggest grossing iPhone apps in September 2018 in the U.S.
More Information
Video Games
Oct 19, 2018
This chart shows the most anticiptaed video games in the fall of 2018.
More Information
Graphics Cards
Oct 19, 2018
This chart shows Nvidia and Radeon GPU pricing from April 2017 to October 2018 (U.S. dollars).
More Information
Tech
Oct 19, 2018
This chart shows how frequently people in the UK use their smartphones during certain situations in 2018.
More Information
Afghanistan Elections
Oct 19, 2018
This chart presents selected results of the Gallup World Poll in Afghanistan from 2014 to 2018.
More Information
Infrastructure
Oct 19, 2018
This infographic shows the countries worldwide with the highest ranked road quality and road connectivity.
More Information
Guitar Players
Oct 18, 2018
This chart shows the gender breakdown of new guitar players and the reasons for starting the guitar.
More Information
NBA
Oct 18, 2018
This chart shows the NBA franchise value in 2018 and 5-year winning percentage by team.
More Information
Government Budget
Oct 18, 2018
This chart shows the U.S. deficit in billions of U.S. dollars as a share of GDP for fiscal year 2017-2018.
More Information
Web Search
Oct 18, 2018
This chart shows market share of the top 3 search engines in the United States, Europe and China in July 2018.
More Information
Connectivity
Oct 18, 2018
This chart shows the share of the population with access to the internet in 2016
More Information
Saudi Arabia
Oct 18, 2018
This chart shows the share of adults considering Saudi Arabia a friend of enemy of the U.S. in October 2018.
More Information
Saudi Arabia
Oct 18, 2018
This chart shows the funding allocation of the 2017 and 2018 Saudi budgets (billion Saudi riyals).
More Information
Australia
Oct 17, 2018
This chart shows the number of annual complaints made to the Telecommunications Industry Ombudsman in Australia.
More Information
Streaming
Oct 17, 2018
This chart shows the contribution margin of 'international streaming' for Netflix, Inc.
More Information
Russia
Oct 17, 2018
This chart shows total Russian military spending on nuclear weapons (billion roubles).
More Information
Sharing Economy
Oct 17, 2018
This chart shows the sales value of the sharing economy service provider market in Japan from fiscal year 2015 to 2022.
More Information
India
Oct 17, 2018
This chart shows the share of the wearables market across India as of Q2 2018, by company.
More Information
Cannabis Legalization
Oct 17, 2018
This chart shows the number of people in Canada consuming cannabis daily from 1990 to 2017.
More Information
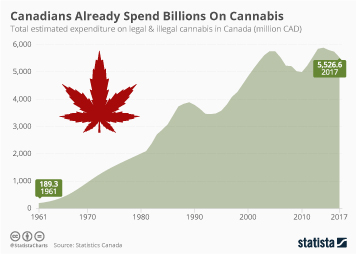
Canada Cannabis Legalization
Oct 17, 2018
This chart shows total estimated expenditure on legal and illegal cannabis in Canada (million CAD).
More Information
World Economy
Oct 16, 2018
This chart shows the percent change between 2017 GDP growth and projected 2018 GDP growth.
More Information
Amazon Prime
Oct 16, 2018
This chart shows why Amazon Prime members in the U.S. subscribed to the program.
More Information
Saudi Arabia
Oct 16, 2018
This chart shows the value of U.S. arms exports to Saudi Arabia (in million TIV)*.
More Information
New Survey
Oct 16, 2018
This chart shows the entertainers with the best net favorability ratings in the U.S. in 2018.
More Information
China
Oct 16, 2018
This chart shows annual car sales growth in China from 2009 to 2018.
More Information
Ceasarean Sections
Oct 16, 2018
This chart shows caesarean rates by country (most recent available year).
More Information
Technology and Health
Oct 15, 2018
This chart shows the count of deaths from selfies between October 2011 and November 2017.
More Information
Streaming Services
Oct 15, 2018
This chart shows the percent of upcoming shows by genre from select streaming services.
More Information
Smartphones
Oct 15, 2018
This chart shows the most downloaded iPhone apps in the UK in April 2019.
More Information
Urban Mobility
Oct 15, 2018
This chart shows the public perception of e-scooters in major U.S. cities in 2018.
More Information
Syria
Oct 15, 2018
This chart shows the number of attacks in Syria involving chemical weapons.
More Information
Ironman Hawaii
Oct 15, 2018
This chart shows the past 10 winners of the Ironman World Championship in Hawaii.
More Information
Brexit
Oct 15, 2018
This chart shows the planned stages of Brexit from October 2018 to 2020.
More Information
Natural Disasters
Oct 15, 2018
This chart shows the total economic cost of global climate-related disasters over 20-year periods.
More Information
Search
Oct 12, 2018
This chart shows the average daily direct search queries on duckduckgo.com from 2010 to 2018.
More Information
Digital Content
Oct 12, 2018
This chart shows how many consumers in the UK and the US have paid for digital content across several categories.
More Information
Music
Oct 12, 2018
This chart ranks the most popular music genres in the world.
More Information
Brexit
Oct 12, 2018
This chart is part of a Statista mini-series profiling the Brexit negotiators.
More Information
Poverty
Oct 12, 2018
This chart shows what UK households have done in response to high/unaffordable food prices as of 2018.
More Information
Mental Health
Oct 11, 2018
This chart shows an overview of mental health statistics in the United States.
More Information
Voting
Oct 11, 2018
This chart shows the percent of respondents who believe the following topics are appropriate for celebrities to speak on.
More Information
Stock market
Oct 11, 2018
This chart shows the losses in market capitalization that U.S. tech companies suffered on Wednesday, October 10, 2018.
More Information
Soccer
Oct 11, 2018
This chart provides an overview of how prize money and solidarity fees are paid out to the 55 competitors.
More Information
United Kingdom
Oct 11, 2018
This chart shows the results of a survey in Northern Ireland into whether people think Brexit would be worth risking the peace process.
More Information
Supreme Court
Oct 10, 2018
This chart shows the share of religions on the Supreme Court between 1789-2018.
More Information
Climate Change
Oct 10, 2018
This chart shows global CO2 emissions to 2017 and reduction recommendations of IPCC.
More Information
Afghanistan
Oct 10, 2018
This chart shows civilians killed and injured in aerial operations in Afghanistan (2009-2018)*.
More Information
Smart Home
Oct 10, 2018
This chart shows a forecast of global smart home device shipments.
More Information
Australia
Oct 10, 2018
This chart shows the market share of leading mobile vendors in Australia in 2018.
More Information
India
Oct 10, 2018
This chart shows the market share of music apps across India in January and March of 2018.
More Information
Global Youth
Oct 9, 2018
This chart shows the share of young people who think their future living conditions will be better by select countries.
More Information
Social Media
Oct 9, 2018
This chart shows how frequently U.S. teenagers are using social media.
More Information
Japan
Oct 9, 2018
Number of international visitors to Japan and visitor spending from 2011 to 2017.
More Information
Unemployment
Oct 9, 2018
This chart shows the preliminary unemployment rate for select US localities for August 2018.
More Information
Tencent
Oct 9, 2018
This chart shows Tencent's net profit from Q4 2016 to Q2 2018 (in million yuan).
More Information
Nobel Prize
Oct 9, 2018
This chart shows Nobel Prize winners by gender from 1901 to 2018.
More Information
Electric Cars
Oct 9, 2018
This chart shows the number of electric vehicle charging points per 100km of paved road.
More Information
Yemen Civil War
Oct 8, 2018
This chart shows the percent change in civilian deaths from the Yemen civil war between June and August 2018.
More Information
Gaming
Oct 8, 2018
This chart shows the share of U.S. adults for which the following statements regarding esports are true in 2018.
More Information
European Union
Oct 8, 2018
This chart shows the number of deaths due to accidents per 100,000 inhabitants in 2015
More Information
Technology
Oct 8, 2018
This chart shows the smartphones with the highest market share in selected countries in July 2018.
More Information
Pence's Walk Out
Oct 8, 2018
This chart shows the cost of Mike Pence's trip to see the Colts play the 49ers on Oct 8, 2017
More Information
106
/
161
Contact
Get in touch with us. We are happy to help.
Do you still have questions?
Feel free to contact us anytime using our
contact form
or visit our
FAQ page
.
Your contact to the Infographics Newsroom
Felix Richter
Data Journalist
felix.richter@statista.com
+49 (40) 284 841 557