Skip to main content
Consumer Goods & FMCG
E-Commerce
Economy & Politics
Energy & Environment
Health, Pharma & Medtech
Internet
Media
Technology & Telecommunications
Transportation & Logistics
Travel, Tourism & Hospitality
View all industries
Global data volume growth
Global AI market size
Number of generative AI users worldwide
Global inflation rate
Retail e-commerce sales worldwide
Largest economies worldwide
Biggest social media platforms by users
Global EV market share by manufacturer
International tourist arrivals by world region
Global annual CO₂ emissions
Browse recent statistics
Artificial intelligence (AI) worldwide
TikTok
Nvidia
E-commerce worldwide
Global GDP
Instagram
Apparel market worldwide
Video gaming worldwide
Global renewable energy industry
Influencer marketing worldwide
Browse recent topics
Consumer Trends 2026
Artificial Intelligence: in-depth market analysis
E-commerce challenges
Global economy
TikTok
Luxury goods: in-depth market analysis
Electric vehicles: A global overview
Video gaming worldwide
Travel and tourism trends 2026
Battery recycling worldwide
Browse recent reports
Explore the tool
Explore Classic mode
Advertising & Media
eCommerce
Consumer
Finance
Global Indicators
Health
Industrial
Mobility
Technology
Explore Market Insights
eCommerce Insights
Research AI
Book a demo
All integrations
Developer docs
Explore Statista Connect
Research
Strategy & Consulting
Marketing
Media & PR
Explore AI assistants
Marketing
Research & Development
Strategy
Sales
Find the fact
Tell the story
Win the pitch
Understand the market
Develop your strategy
Academia
Agencies
Consultancies
Consumer goods
Finance
Tech
Research solutions
Strategy consulting
Communication services
Explore Statista+
Statista R
Statista Healthcare
About Statista
First steps & help center
Webinar & training hub
Success stories
Individuals & Small Teams
Businesses & Enterprises
Academia & Government
English
Deutsch
Daily Data
Global stories vividly visualized
European Union
Dec 1, 2016
This chart shows the percentage of Europeans who disapprove/approve of the EU's handling of economic issues.
More Information
Music Industry
Dec 1, 2016
This chart shows the pre-tax income before management fees of the world's highest earning musicians in 2016.
More Information
iPhone market
Dec 1, 2016
This graphic shows the percentage of Apple's global iPhone shipments that went to China in 2015 & 2016.
More Information
Hate Crime
Dec 1, 2016
This chart shows daily hate incidents and motivation in the U.S. in November 2016.
More Information
Work
Dec 1, 2016
This chart shows the estimated annual cost of sleep deprivation in the UK in GDP terms.
More Information
Demography
Nov 30, 2016
This chart shows the countries with the highest life expectancy in the world as of 2015.
More Information
Social Media
Nov 30, 2016
This chart shows the percentage of U.S. users on each platform utilizing it for finding/shopping for products in 2016.
More Information
Virtual Reality Shipment Forecast
Nov 30, 2016
This chart shows a forecast of 2016 VR headset shipments.
More Information
Economy
Nov 30, 2016
This chart shows the global distribution of individuals with a fortune of one million dollars or more in 2016.
More Information
Voice Assistance
Nov 30, 2016
This chart shows U.S. smartphone owners using voice assistance and reasons for use.
More Information
Autonomous vehicles
Nov 30, 2016
This chart shows the companies planning to release a self-driving vehicle in the next five years.
More Information
Life Expectancy
Nov 30, 2016
This chart shows the life expectancy of males and females from birth in the UK in years (2013 to 2015).
More Information
Billionaires
Nov 30, 2016
This chart shows the number of billionaire graduates from global universities & total wealth (2016-17).
More Information
Crime
Nov 30, 2016
This chart shows the percentage of Europeans agreeing that sexual intercourse without consent is justified in certain situations.
More Information
Religion
Nov 30, 2016
This chart shows favourable views of Saudi Arabia & Iran in selected countries in 2015.
More Information
Time
Nov 30, 2016
This chart shows average hours per day spent on activities in 2015.
More Information
Millennials
Nov 30, 2016
This chart shows the percentage of Millennials saying they have "quite a lot" of confidence in the future of the U.S.
More Information
Article 50
Nov 30, 2016
This chart shows the stance of UK MPs in the EU referendum by party.
More Information
UK SME
Nov 30, 2016
This chart compares the amount of hard/software a small business would get for £50 thousand pre- and post-Brexit.
More Information
Uber
Nov 29, 2016
This chart shows the estimated hourly earnings of Uber drivers & taxi/chauffeur drivers in major U.S. cities.
More Information
European Union
Nov 29, 2016
This chart shows the percentage of EU property owners with a mortgage or loan in 2014.
More Information
Telecommuting
Nov 29, 2016
This chart shows the number of workdays U.S. employees telecommute in a typical month.
More Information
Weekly Wages
Nov 29, 2016
This chart shows average weekly wages in Q3 2015 by meto area (adjusted by regional price parities).
More Information
Drug Seizures
Nov 29, 2016
This chart shows the number, quantity and value of drugs seized in Ireland from 2013 to 2015.
More Information
Wikipedia launched its annual fundraising campaign
Nov 28, 2016
This chart shows how much money the Wikimedia Foundation received in the form donations and contributions since 2007.
More Information
Economy
Nov 28, 2016
this chart shows a breakdown of real estate transaction volume share in Europe from 2015 to 2016.
More Information
Homelessness In Ireland
Nov 28, 2016
This chart shows the increase in children in homeless emergency accommodation in the South West 2014-2017.
More Information
Homelessness In Ireland
Nov 28, 2016
This charts shows the increase in young adults (18-24) in homeless emergency accommodation in Ireland 2014-2017.
More Information
France 2017
Nov 28, 2016
This chart shows the result of a voting intention poll for the French presidential election 2017.
More Information
Soccer
Nov 28, 2016
This chart shows the cost of seeing one goal based on 2015/16 ticket prices and home results.
More Information
U.S. Presidential Election
Nov 28, 2016
This chart shows elections in which the elected U.S. President didn’t get the greater share of the popular vote but won the electoral...
More Information
UKIP
Nov 28, 2016
This chart shows responses to the question: "on average, how often do you wear your underpants/knickers before washing them?"
More Information
Offshore Tax Havens
Nov 28, 2016
This chart shows federal loans, bailouts and loan guarantees to U.S. companies and money held offshore.
More Information
U.S. – Cuban Relations
Nov 28, 2016
This chart shows Fidel Castro’s time in power and his U.S. counterparts during that time
More Information
E-Commerce
Nov 25, 2016
This chart shows desktop spending on Cyber Monday in the U.S. from 2005 to 2015.
More Information
Europe
Nov 25, 2016
This chart shows the % of young people (18-24) considering moving to another country in 2016.
More Information
Infrastructure
Nov 25, 2016
This chart shows the estimated average weekday travel time from selected U.S. airports to downtown.
More Information
Drugs
Nov 25, 2016
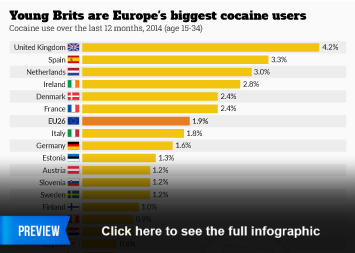
This chart shows cocaine use over the last 12 months, 2014 (age 15-34).
More Information
How social media influences shopping behavior
Nov 24, 2016
This chart shows how social media influences shopping behavior.
More Information
Millionaires
Nov 24, 2016
This chart shows the number of millionaires by country and change from 2015 to 2016.
More Information
Voice Assistants
Nov 24, 2016
This chart shows the share of UK smartphone users that use an assistant app and for which purpose.
More Information
Revenues from online food deliveries expected to rise
Nov 24, 2016
This chart provides a forecast of online food delivery revenues in selected markets.
More Information
Banking
Nov 24, 2016
This chart shows the salaries of selected Central Bank Governors in Europe as of November 2016.
More Information
Election 2016
Nov 24, 2016
This chart shows what UK survey respondents think will happen with Trump as US President.
More Information
Thanksgiving Weekend
Nov 24, 2016
This chart shows the product categories most likely to be purchased spontaneously on Black Friday in the U.S. in 2016.
More Information
Holiday Season
Nov 24, 2016
This chart shows what U.S. holiday shoppers plan to buy this year.
More Information
Media Industry
Nov 23, 2016
This chart shows the annual publishing revenue by country in 2015 (in billion euros)
More Information
National Parks
Nov 23, 2016
This chart shows the average annual visitors to U.S. national parks since 1996.
More Information
Crime
Nov 23, 2016
This chart shows the number of arrest warrants received by Ireland.
More Information
Hate Crimes
Nov 23, 2016
This chart shows the number of anti-Muslim assaults reported to the FBI from 2000 to 2015.
More Information
Crime
Nov 23, 2016
This chart shows the number of arrest warrants issued by Ireland.
More Information
Election 2016
Nov 23, 2016
This chart shows the number of votes received by the two main candidates in three key election 2016 states.
More Information
Thanksgiving
Nov 23, 2016
This chart shows the most popular elements of a Thanksgiving dinner in the U.S. in 2016.
More Information
Holiday shopping season
Nov 23, 2016
This chart shows the most important factors in choosing a retailer during the holiday season.
More Information
Thanksgiving
Nov 23, 2016
This chart shows Thanksgiving weekend e-commerce sales compared to average daily sales in the U.S.
More Information
Autumn Statement
Nov 23, 2016
This chart shows the United Kingdom economic growth forecast as of 23 November, 2016.
More Information
Black Friday
Nov 22, 2016
This chart shows when Americans plan to do the majority of their holiday shopping.
More Information
Royal Family
Nov 22, 2016
This chart shows the economic benefits and costs of the royal family in 2015.
More Information
University
Nov 22, 2016
This chart shows the number of foreign students at U.S. colleges by nationality in 2015-2016.
More Information
Trans-Pacific Partnership
Nov 22, 2016
This chart shows the total value of goods traded by TPP countries with the U.S. in 2015.
More Information
USA
Nov 22, 2016
This chart shows the fields in which recipients of the Presidential Medal of Freedom from Obama were active in (2009-2016).
More Information
Holiday shopping season
Nov 22, 2016
This chart shows how Americans use their smartphones while shopping for the holidays.
More Information
Wages and Salary
Nov 21, 2016
This chart shows starting wages in selected Irish public sector professions in 2010 and 2016.
More Information
France centre-right primary
Nov 21, 2016
This graphic shows the results of the centre-right presidential primary in France.
More Information
Drugs
Nov 21, 2016
This chart shows the average maximum years of imprisonment for drug possession in 2016.
More Information
Business Graduates
Nov 21, 2016
This chart shows the average starting salary for U.S. business majors in 2015.
More Information
Apps
Nov 21, 2016
This chart shows the number of countries where the following apps are restricted/users were arrested in 2016.
More Information
Infidelity
Nov 21, 2016
This chart shows the percentage of married adults who have admitted having an affair.
More Information
Main Street
Nov 18, 2016
Most expensive locations to rent retail space by city & country 2016
More Information
Metallica Album Release
Nov 18, 2016
This chart shows metal & hard rock albums that went at least 10x Platinum (Diamond) in the U.S.
More Information
Tech
Nov 18, 2016
This chart shows worldwide smartphone end user sales of the top five producers from Q3 2015 to Q3 2016.
More Information
Drugs
Nov 18, 2016
Drug-induced and motor vehicle crash deaths in the U.S. from 2004 to 2014.
More Information
Tech
Nov 18, 2016
This chart shows forecasted cumulative global artificial intelligence revenue 2016-2025, by use case.
More Information
Jihadist Recruitment
Nov 18, 2016
This chart shows the number of known foreign fighters from European towns and cities.
More Information
Deadly Traffic Accidents
Nov 17, 2016
This chart shows fatality rates per 100 million vehicle miles of travel since 2005 (Jan-June consecutively)
More Information
Planned IPO
Nov 17, 2016
This chart shows a breakdown of Snapchat, Facebook and Twitter app users in the U.S. by age group.
More Information
Tinder
Nov 17, 2016
This chart shows the most downloaded dating apps around the world in 2015.
More Information
Facebook
Nov 17, 2016
This chart shows the Facebook engagement of fake news stories on the US election 2016.
More Information
Air Pollution
Nov 17, 2016
This chart shows PM2.5 in selected cities worldwide.
More Information
World Terrorism Index
Nov 17, 2016
This chart shows the spread of terrorist attacks around the world in percent
More Information
Religion
Nov 17, 2016
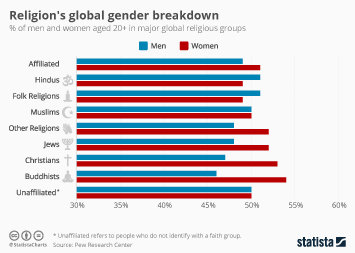
This chart shows the percentage of men and women aged 20+ in major global religious groups.
More Information
Calexit
Nov 17, 2016
This chart shows the estimated GDP in countries/territories in 2015.
More Information
New Rowling Movie
Nov 16, 2016
The chart shows worldwide box office revenue of the Harry Potter movies (in million $)
More Information
European Union
Nov 16, 2016
This chart shows the average expected years of working life in the EU in 2015.
More Information
Working
Nov 16, 2016
This chart shows the top five cities by % of people "satisfied" and "not satisfied" with their personal job situation.
More Information
Wages and Salary
Nov 16, 2016
This chart shows the annial salary of selected world leaders in 2016.
More Information
U.S. President in Germany
Nov 16, 2016
This chart shows the volume of U.S. imports and exports of trade goods from and to Germany (in billion U.S. dollars)
More Information
Humanitarian Crisis
Nov 16, 2016
This infographic casts light on the humanitarian crisis in Nigeria in November 2016.
More Information
Smartphones
Nov 15, 2016
This chart shows what people will do with their old smartphones when they buy a new one.
More Information
Ireland
Nov 15, 2016
This chart shows the total number of baptisms and births in Ireland from 2007 to 2014.
More Information
134
/
161
Contact
Get in touch with us. We are happy to help.
Do you still have questions?
Feel free to contact us anytime using our
contact form
or visit our
FAQ page
.
Your contact to the Infographics Newsroom
Felix Richter
Data Journalist
felix.richter@statista.com
+49 (40) 284 841 557