Snapchat is set to go public with its IPO next year, with an expected company value of around 25 billion dollars, making it potentially the biggest U.S. tech IPO since Facebook. While this initial valuation is impressive, some are questioning the longevity of an app which relies heavily on users at the younger end of the scale. As the chart below shows, when compared to Twitter and Facebook, the age spread of Snapchat users is much more weighted to the 18-24 years group (Comscore only surveyed adults). Facebook enjoys a much healthier spread of U.S. smartphone owners. Although Twitter users are also rather more youthful, the differences aren't anywhere near as pronounced as with Snapchat. It could be that Snapchat has some growing up to do if it is to thrive in the long-term.
Planned IPO
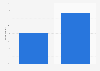
Snapchat Still Has Some Growing Up To Do


Description
This chart shows a breakdown of Snapchat, Facebook and Twitter app users in the U.S. by age group.