Skip to main content
Consumer Goods & FMCG
E-Commerce
Economy & Politics
Energy & Environment
Health, Pharma & Medtech
Internet
Media
Technology & Telecommunications
Transportation & Logistics
Travel, Tourism & Hospitality
View all industries
Global data volume growth
Global AI market size
Number of generative AI users worldwide
Global inflation rate
Retail e-commerce sales worldwide
Largest economies worldwide
Biggest social media platforms by users
Global EV market share by manufacturer
International tourist arrivals by world region
Global annual CO₂ emissions
Browse recent statistics
Artificial intelligence (AI) worldwide
TikTok
Nvidia
E-commerce worldwide
Global GDP
Instagram
Apparel market worldwide
Video gaming worldwide
Global renewable energy industry
Influencer marketing worldwide
Browse recent topics
Consumer Trends 2026
Artificial Intelligence: in-depth market analysis
E-commerce challenges
Global economy
TikTok
Luxury goods: in-depth market analysis
Electric vehicles: A global overview
Video gaming worldwide
Travel and tourism trends 2026
Battery recycling worldwide
Browse recent reports
Explore the tool
Explore Classic mode
Advertising & Media
eCommerce
Consumer
Finance
Global Indicators
Health
Industrial
Mobility
Technology
Explore Market Insights
eCommerce Insights
Research AI
Book a demo
All integrations
Developer docs
Explore Statista Connect
Research
Strategy & Consulting
Marketing
Media & PR
Explore AI assistants
Marketing
Research & Development
Strategy
Sales
Find the fact
Tell the story
Win the pitch
Understand the market
Develop your strategy
Academia
Agencies
Consultancies
Consumer goods
Finance
Tech
Research solutions
Strategy consulting
Communication services
Explore Statista+
Statista R
Statista Healthcare
About Statista
First steps & help center
Webinar & training hub
Success stories
Individuals & Small Teams
Businesses & Enterprises
Academia & Government
English
Deutsch
Daily Data
Global stories vividly visualized
Smallest Capitals
Jun 18, 2021
This chart shows the world's smallest capitals in absolute and relative terms (2018).
More Information
Podcasts
Jun 18, 2021
This chart shows the most widely used podcast platforms in the United States.
More Information
Sport
Jun 17, 2021
This chart looks at the footballing history between England and Scotland.
More Information
Podcasts
Jun 17, 2021
This chart shows how many Americans listen to podcasts.
More Information
Juneteenth
Jun 16, 2021
This chart shows survey responses among U.S. adults about Juneteenth (2021).
More Information
U.S. Bicycle Market
Jun 16, 2021
This chart shows the number of bicycles imported to and sold in the United States since 2000.
More Information
WFH
Jun 16, 2021
This chart shows the share of Japanese working from home during the COVID-19 pandemic (2020-2021).
More Information
U.S. Military
Jun 16, 2021
This chart shows U.S. military weapons that were unaccounted for between 2010 and 2019.
More Information
Food Delivery
Jun 16, 2021
This chart shows the share of U.S. respondents who ordered restaurant/food delivery online from the following brands in 2021
More Information
South Korea
Jun 15, 2021
This chart shows survey responses among Koreans about tattoos (2019).
More Information
Real Estate
Jun 15, 2021
This chart shows the average amount it is cheaper/more expensive to rent than to buy a home in Great Britain in 2021.
More Information
Westminster Kennel Club
Jun 15, 2021
This chart shows the breeds that have won "Best in Show" at Westminister Kennel Club dog show most often.
More Information
Traffic Fatalities
Jun 15, 2021
This chart shows total U.S. traffic fatalities by year and fatality rate per 100 million vehicle miles traveled.
More Information
Belt & Road Initiative
Jun 14, 2021
This chart shows Chinese Belt & Road Initiative investments by world region in 2020 (in billion U.S. dollars).
More Information
Israel
Jun 14, 2021
This chart shows the total time in office served by Israeli prime ministers as of June 14, 2021.
More Information
World Cup
Jun 11, 2021
This chart shows the results of matches between England and Croatia and key facts for both teams.
More Information
Ocean Waste
Jun 11, 2021
This chart shows the 10 most widespread waste items polluting the world's oceans.
More Information
Smallest Countries
Jun 11, 2021
This chart shows the smallest countries worldwide based on land area.
More Information
Marriage
Jun 10, 2021
This chart shows the share of U.S. adults that think same-sex marriages should or should not be recognized as valid by law from 2004...
More Information
UEFA Euro 2020
Jun 10, 2021
This chart shows the share of soccer fans in selected countries saying it's a bad idea to hold the Euros in 11 different countries...
More Information
Wealth
Jun 10, 2021
This chart shows countries holding the highest value of private offshore wealth in 2020.
More Information
Bitcoin
Jun 10, 2021
This chart shows the estimated realized dollar gains from Bitcoin by country in 2020.
More Information
U.S.-Mexico Border
Jun 10, 2021
This chart shows monthly number of children and individuals in family units detained at the U.S.-Mexico border in FY19/20/21.
More Information
Europe
Jun 10, 2021
This chart shows the cost of mental health as a percentage of GDP in Europe.
More Information
Pandemic
Jun 9, 2021
This chart shows public attitudes in England to potential easing of Covid restrictions in June 2021.
More Information
Tax
Jun 9, 2021
This chart shows wealth growth and taxes paid by America's 25 wealthiest individuals from 2014 to 2018.
More Information
COVID-19 in India
Jun 8, 2021
This chart shows survey results about COVID-19 and fake news in India (2020).
More Information
Messaging and video chat apps
Jun 8, 2021
This chart shows the most popular messaging and video chat apps in the U.S.
More Information
Survey
Jun 8, 2021
This chart presents the results of the survey question: "Which one of the following insects/bugs/creepy-crawlies do you dislike the...
More Information
Sport
Jun 8, 2021
This chart shows the results of a survey into the expectations and desires in relation to the Euro 2020 winner.
More Information
European Union
Jun 8, 2021
This chart shows the share of total EU bicycle imports by origin country in 2020.
More Information
Amazon
Jun 8, 2021
This chart shows the injury rate per 100 full-time employees at U.S. warehouses in 2020.
More Information
World Oceans Day
Jun 7, 2021
This chart shows the average annual revenue loss from illicit marine fishing in the most affected oceans (in billion U.S. dollars).
More Information
Working From Home
Jun 7, 2021
This chart shows the benefits of working from home as perceived by U.S. employees currently working remotely.
More Information
Remote Work Policy
Jun 7, 2021
This chart shows the preferred post-pandemic working environment for U.S. employees currently working from home.
More Information
Representation in the Workplace
Jun 7, 2021
This chart shows the share of respondents who said that at work they were often/almost always the only one in the room of their gender/race/ethnicity/sexual...
More Information
Coronavirus
Jun 4, 2021
This chart shows the estimated share of the England population age groups testing positive for Covid-19 (week ending 29 May 2021).
More Information
Marriage
Jun 4, 2021
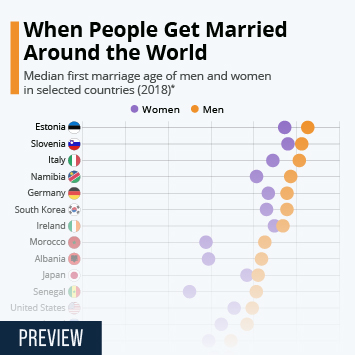
This chart shows median marriage ages in different countries around the world.
More Information
Sport
Jun 3, 2021
This chart shows the coefficient for Euro 2020 team strength based on domestic experience and competitiveness of squad in 2020/21.
More Information
Plastic Pollution
Jun 3, 2021
This chart shows the continents by their estimated share of global plastic emissions into oceans caused by rivers.
More Information
Politics
Jun 3, 2021
This chart shows UK spending on Overseas Development Aid as a share of gross national income from 1970 to 2020.
More Information
WallStreetBets
Jun 3, 2021
This chart shows the 2021 stock performance of selected companies targeted by investors on the subreddit WallStreetBets.
More Information
Energy Investment
Jun 3, 2021
This chart shows public money commited to forms of energy in G7 countries (Jan 2020 - Mar 2021).
More Information
Environment
Jun 3, 2021
This chart shows the emission savings of different sustainable lifestyle changes in 2020 (in kg CO2 equivalents/year).
More Information
COVID-19
Jun 2, 2021
This chart shows the rolling 7-day average of new COVID-19 cases per one million of population in the most affected Asian countries...
More Information
Tokyo Olympic Summer Games
Jun 2, 2021
This chart shows facts and figures about the Olympic Summer Games 2020/21 in Tokyo.
More Information
Covid-19
Jun 2, 2021
This chart shows growth in healthcare expenditure in the UK from 1998 to 2020.
More Information
COVID-19
Jun 2, 2021
This chart shows the countries with the highest month-to-month increase in oxygen need between April and May 2021.
More Information
Millionaires
Jun 2, 2021
This chart shows the share of people with assets of at least $5 million who play/watch the following sports in 2021.
More Information
Brazil
Jun 2, 2021
This chart shows the effects on Serrana when 75% of its inhabitants were fully vaccinated with CoronaVac*
More Information
Football
Jun 2, 2021
This chart shows the clubs which players in the provisional England Euro 2020 squad play for domestically.
More Information
Korean Military Balance
Jun 2, 2021
This chart shows the military strength of North and South Korea in comparison.
More Information
Microchip Shortage
Jun 1, 2021
This chart shows the estimated number of vehicles taken out of production due to microchip shortages.
More Information
U.S. Wars
Jun 1, 2021
This chart shows the share of Americans who think it was a mistake for the U.S. to send troops to fight in the following wars.
More Information
UFOs
May 31, 2021
This chart shows survey responses from U.S. adults on the existence of alien spacecraft among UFO sightings (2019).
More Information
World No Tobacco Day
May 31, 2021
This chart shows the countries with the biggest share of the world's smokers and the world's population in 2020.
More Information
Mobility
May 31, 2021
This chart shows the change in financial cost of travel in the UK from May 2011 to April 2021, by type and compared to the cost of...
More Information
PS5
May 28, 2021
This chart shows active users of Sony's PS4 and PS5 gaming consoles after their respective release dates.
More Information
Mobility
May 28, 2021
This chart shows the revenue growth of selected modes of transportation worldwide in 2019, 2020 and 2021 (in percent).
More Information
Father's Day
May 28, 2021
This chart shows weeks of paid parental leave that can only be taken by the father.
More Information
Statista Survey
May 28, 2021
This chart shows the share of survey respondents in selected countries saying they have spent money on professional training.
More Information
Amazon
May 27, 2021
This chart shows the most expensive acquisition by Amazon (in billion U.S. dollars).
More Information
Clean Energy Transition
May 27, 2021
This chart shows clean energy technologies' share of demand for selected minerals (in percent).
More Information
Economy
May 27, 2021
This chart shows the change in total UK goods imports from top five import partners from Q1 2018 to Q1 2021.
More Information
GDP Growth
May 27, 2021
This chart shows 2021 Q1 GDP growth in selected countries.
More Information
Facebook
May 27, 2021
This chart shows coordinated Inauthentic Behavior networks removed by Facebook by country of origin (2017-2020)*.
More Information
FMCG
May 26, 2021
This chart shows the share of survey respondents saying the regularly drink beer, by country.
More Information
COVID-19 Vaccines
May 26, 2021
This chart shows COVID-19 vaccine candidates by clinical trial phase and national origin (as of May 25, 2021).
More Information
Beverages
May 26, 2021
This chart shows estimated revenue generated from tea in 2020, by country.
More Information
COVID-19 in India
May 26, 2021
This chart shows the share of respondents among Urban Indians saying the following worried them as a result of the COVID-19 pandemic.
More Information
Soccer
May 26, 2021
This chart shows top-tier UEFA soccer clubs by type of revenue lost due to the Covid-19 pandemic.
More Information
Internet
May 25, 2021
This chart shows the share of survey respondents saying they are often annoyed by advertising on the internet.
More Information
Racial Justice
May 25, 2021
This chart shows the share of respondents naming race relations/racial justice as the most important problem facing the U.S. in 2020/2021.
More Information
Police Reform
May 25, 2021
This chart shows police reform bills by state since the death of George Floyd.
More Information
Electric Vehicles
May 25, 2021
This chart shows total electric vehicle sales by model in the U.S. over the preceeding 3 years.
More Information
Economy
May 25, 2021
This chart shows UK public sector net borrowing excluding public sector banks from 1993 to 2021.
More Information
Belarus Crisis
May 25, 2021
This chart shows where Belarus ranks globally in major international surveys/reports.
More Information
Coal
May 21, 2021
This chart shows the biggest exporters of coal in the world in 2019.
More Information
Agriculture
May 20, 2021
This chart shows the import of selected grains into China.
More Information
Beekeeping
May 20, 2021
This chart shows the number of beehives by world region in 1969 and 2019.
More Information
Video Game Streaming
May 20, 2021
This chart shows the share of gamers who used the following streaming websites in the last 12 months.
More Information
Cryptocurrencies
May 19, 2021
This chart shows the price of Bitcoin in May 2021.
More Information
Health
May 19, 2021
This chart shows the countries with the biggest changes in total per capita alcohol consumption between 2010 and 2018.
More Information
Football
May 19, 2021
This chart shows the average time between fouls committed by Premier League football teams in 2020/21 domestic league matches.
More Information
Wages and Salaries
May 19, 2021
This chart shows the year-over-year change in the average tech salary.
More Information
Covid-19 Pandemic
May 19, 2021
This chart shows the number of vaccine doses produced and exported as of March 2021.
More Information
COVID-19
May 19, 2021
This chart shows the index of the rise and fall of daily new COVID-19 cases/deaths (7-day rolling average) in India (2021).
More Information
Plastic Waste
May 19, 2021
This chart shows the companies contributing the most to single-use plastic waste in 2019.
More Information
Smart Homes
May 18, 2021
This chart shows the forecast revenue growth of the U.S. smart home security sector.
More Information
Plastic Waste
May 18, 2021
This chart shows single-use plastic waste generated per person in selected countries in 2019.
More Information
64
/
161
Contact
Get in touch with us. We are happy to help.
Do you still have questions?
Feel free to contact us anytime using our
contact form
or visit our
FAQ page
.
Your contact to the Infographics Newsroom
Felix Richter
Data Journalist
felix.richter@statista.com
+49 (40) 284 841 557