Skip to main content
Consumer Goods & FMCG
E-Commerce
Economy & Politics
Energy & Environment
Health, Pharma & Medtech
Internet
Media
Technology & Telecommunications
Transportation & Logistics
Travel, Tourism & Hospitality
View all industries
Global data volume growth
Global AI market size
Number of generative AI users worldwide
Global inflation rate
Retail e-commerce sales worldwide
Largest economies worldwide
Biggest social media platforms by users
Global EV market share by manufacturer
International tourist arrivals by world region
Global annual CO₂ emissions
Browse recent statistics
Artificial intelligence (AI) worldwide
TikTok
Nvidia
E-commerce worldwide
Global GDP
Instagram
Apparel market worldwide
Video gaming worldwide
Global renewable energy industry
Influencer marketing worldwide
Browse recent topics
Consumer Trends 2026
Artificial Intelligence: in-depth market analysis
E-commerce challenges
Global economy
TikTok
Luxury goods: in-depth market analysis
Electric vehicles: A global overview
Video gaming worldwide
Travel and tourism trends 2026
Battery recycling worldwide
Browse recent reports
Explore the tool
Explore Classic mode
Advertising & Media
eCommerce
Consumer
Finance
Global Indicators
Health
Industrial
Mobility
Technology
Explore Market Insights
eCommerce Insights
Research AI
Book a demo
All integrations
Developer docs
Explore Statista Connect
Research
Strategy & Consulting
Marketing
Media & PR
Explore AI assistants
Marketing
Research & Development
Strategy
Sales
Find the fact
Tell the story
Win the pitch
Understand the market
Develop your strategy
Academia
Agencies
Consultancies
Consumer goods
Finance
Tech
Research solutions
Strategy consulting
Communication services
Explore Statista+
Statista R
Statista Healthcare
About Statista
First steps & help center
Webinar & training hub
Success stories
Individuals & Small Teams
Businesses & Enterprises
Academia & Government
English
Deutsch
Daily Data
Global stories vividly visualized
Afghanistan
Jul 26, 2021
This chart shows total civilian casualties in Afghanistan in the first six months of the year.
More Information
Air Travel
Jul 23, 2021
This chart shows loose change collected at U.S. airports in fiscal year 2020.
More Information
Air Travel
Jul 23, 2021
This chart shows U.S. airports by the number of confiscated guns in carry-on in 2020
More Information
Nutrition
Jul 23, 2021
This chart shows the share of U.S. adults who follow one or more of the following nutrition rules in 2021.
More Information
Health
Jul 22, 2021
This chart shows the blood type distribution in selected countries around the world (in %).
More Information
Opioid Epidemic
Jul 22, 2021
This chart shows the percentage change in reported drug overdose deaths by U.S. state.
More Information
Covid-19 Pandemic
Jul 22, 2021
This chart shows the share of people in India with SARS-CoV-2 antibodies as of July 2021.
More Information
Natural Disasters
Jul 22, 2021
This chart shows the cost of natural disaster losses worldwide from 2000 to 2021.
More Information
U.S. Economy
Jul 20, 2021
This chart shows the length of recessions in the United States since World War II.
More Information
Food
Jul 20, 2021
Thi chart shows national annual U.S. food expenditure and its estimated true cost as of 2021.
More Information
Tokyo Olympics
Jul 19, 2021
This chart shows how many people in selected countries are opposed to holding the Olympic Games in Tokyo amid the COVID-19 pandemic.
More Information
Football
Jul 16, 2021
This chart shows European football fans' opinions on VAR in 2021.
More Information
Fintech
Jul 16, 2021
This chart shows the most valuable private companies in the UK in July 2021.
More Information
Society
Jul 15, 2021
This chart shows football fans' views on how social media platforms deal with racism on their platforms.
More Information
CEO Pay
Jul 15, 2021
This chart shows the largest CEO-to-worker pay ratios at S&P 500 companies in 2021.
More Information
CEO Pay
Jul 15, 2021
This chart shows U.S. CEO-to-worker pay ratio by industry at S&P 500 Index companies.
More Information
Conservation
Jul 14, 2021
This chart shows the countries exporting the highest value of shark meat 2009-2019.
More Information
Plastic Surgery
Jul 14, 2021
This chart shows the total number of plastic surgery procedures and share of worldwide total in 2019.
More Information
Plastic Surgery
Jul 14, 2021
This chart shows the total number of plastic surgery procedures by type performed in 2019.
More Information
Manatees
Jul 13, 2021
This chart shows the number of manatee deaths recorded in Florida by year.
More Information
Covid-19 Pandemic
Jul 13, 2021
This chart shows the share of Americans reporting that aspects of their lives have returned to complete normality.
More Information
Covid-19 Pandemic
Jul 12, 2021
This chart shows the share of Israeli Covid-19 cases by age group in the month up to July 05, 2021.
More Information
Covid-19 Pandemic
Jul 12, 2021
This chart shows additional expected U.S. Covid-19 deaths under two scenarios up to June 30, 2021.
More Information
Society
Jul 9, 2021
This chart shows the share of 'Generation Z' people that have participated/undertaken certain social activities in the past two years.
More Information
Euro 2020
Jul 9, 2021
This chart looks at the results of matches between England and Italy and key facts for both teams.
More Information
Economy
Jul 9, 2021
This chart shows the estimated change in at-risk-of-poverty rate in the EU from 2019 to 2020.
More Information
Spending Money
Jul 8, 2021
This chart shows the growth or decline of disposable incomes in OECD and affiliated countries.
More Information
Wages and Salary
Jul 8, 2021
This chart shows average early career pay for graduates with a bachelor degree from U.S. universities.
More Information
Human Trafficking
Jul 8, 2021
This chart shows global prosecutions and convictions for human trafficking.
More Information
Bollywood
Jul 7, 2021
This chart shows the most frequent winners of the Filmfare Award for Best Actor and Best Actress (1954-2021).
More Information
Entertainment
Jul 7, 2021
This chart shows the total global watch time of the top games on Twitch in June 2021.
More Information
Cryptocurrencies
Jul 7, 2021
This chart shows operational crypto ATMs by country in 2021.
More Information
Wall Street
Jul 7, 2021
This chart shows the number of IPOs and funds raised on Wall Street by Chinese companies 2009-2021 (Q1).
More Information
Pets
Jul 7, 2021
This chart shows the share of U.S. dog owners who paid the following for their most recent pet in 2020.
More Information
Olympics
Jul 7, 2021
This chart shows current sports in the Summer Olympic Games by year of their addition (1984-2020/21).
More Information
Chocolate
Jul 7, 2021
This chart shows the number of children from agricultural households engaged in work and illicit child labor in cocoa-producing agricultural...
More Information
Covid-19
Jul 6, 2021
This chart shows the share of the public which support or oppose the removal of UK lockdown restrictions in the summer of 2021.
More Information
Food Security
Jul 6, 2021
This chart shows cereal import requirements and the number of undernourished people in North Korea.
More Information
Euro 2020
Jul 6, 2021
This chart shows the footballing history of England vs Denmark.
More Information
Cybersecurity
Jul 6, 2021
This chart shows leading causes of ransomware attacks reported by managed service providers in 2020.
More Information
Afghanistan
Jul 6, 2021
This chart shows selected Afghan military vehicles/equipment items destroyed/captured by the Taliban since June 2021.
More Information
Ransomware Attacks
Jul 6, 2021
This chart shows the total value of cryptocurrency received by known ransomware addresses between 2013 and 2021.
More Information
Amazon
Jul 5, 2021
This chart shows how an investment of $1,000 in Amazon's IPO in 1997 has developed over the years.
More Information
College Sports
Jul 2, 2021
This chart shows total revenue generated by NCAA athletic departments in 2019, by source.
More Information
Box Office
Jul 2, 2021
This chart shows the estimated number of tickets sold at the North American box office since 1995.
More Information
Sport
Jul 2, 2021
This chart shows Google Search interest in England for the term 'it's coming hone' during Euro 2020.
More Information
Wildfires
Jul 2, 2021
This chart shows total wildfires recorded daily in the western U.S. wildland-urban interface.
More Information
Antarctica
Jul 2, 2021
This chart shows record high temperatures recorded on the Antarctic continent.
More Information
Female workers in the tech industry
Jul 1, 2021
This chart shows the percentage of female employees in the workforce of major tech companies.
More Information
Pandemic
Jul 1, 2021
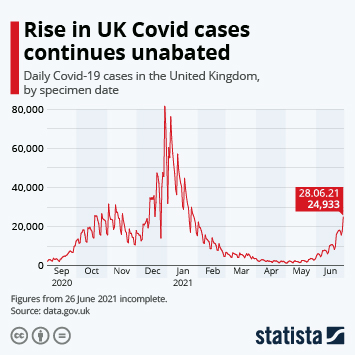
This chart shows the daily reported lab-confirmed Covid-19 cases in the United Kingdom.
More Information
Fireworks injuries
Jul 1, 2021
This chart shows the estimated number of non-occupational fireworks injuries treated in U.S. hospitals
More Information
Tech IPOs
Jun 30, 2021
This chart shows the IPO valuations of selected tech and internet companies.
More Information
Social Conflict
Jun 30, 2021
This chart shows the countries with the highest share of respondents seeing a great/fair amount of tension between liberals and conservatives,
More Information
Tourism
Jun 30, 2021
This chart shows estimated GDP losses by country due to a pandemic-related reduction in tourism in 2021.
More Information
Social Media
Jun 29, 2021
This chart shows the share of U.S. adults who say they regularly use the following social media platforms.
More Information
Plastics
Jun 29, 2021
This chart shows global annual production of plastic by region in 2019 (in percent).
More Information
China's Economy
Jun 29, 2021
This chart shows private sectors contribution to different parts of the Chinese economy (in percent).
More Information
Air Travel
Jun 29, 2021
This chart shows commercial airspace by risk level as of June 24, 2021.
More Information
Digital Wallets
Jun 29, 2021
This chart shows complaints to U.S. federal regulators about digital wallets & payment apps by company (April 2017-April 2021).
More Information
Covid-19 Pandemic
Jun 29, 2021
This chart shows the share who say the EU has done a good job dealing with the coronavirus outbreak.
More Information
Science
Jun 28, 2021
This chart shows GB survey responses to questions about the existence of aliens and UFOs in 2021.
More Information
Health
Jun 28, 2021
This chart shows the share of people that say they have confidence in their own country's health care system to handle a future pandemic.
More Information
COVID-19 in India
Jun 28, 2021
This chart shows the share of respondents newly investing in financial instruments in India (2021).
More Information
UFO Report
Jun 28, 2021
This chart shows U.S. government reports of UAP incidents between Nov 2004 and Mar 2021.
More Information
Infrastructure
Jun 25, 2021
This chart shows the average age of different types of infrastructure in the U.S. 2020-2021 (in years).
More Information
Sport
Jun 25, 2021
This chart shows the results of football matched between the senior men's teams of England and Germany.
More Information
Plastic Pollution
Jun 25, 2021
This chart shows the most prevalent forms of plastic waste detected in European waterways.
More Information
Pandemic
Jun 25, 2021
This chart shows the average change in minutes spent on activities per day in Great Britain (28 Mar-26 Apr 2020 to 20-28 Mar 2021).
More Information
Manufacturing
Jun 25, 2021
This chart shows the number of cars manufactured in the UK in May of 2019, 2020 and 2021.
More Information
Police Shootings
Jun 25, 2021
This chart shows outcomes for all non-federal law enforcement officers arrested for murder or manslaughter shooting deaths between...
More Information
Dog Imports
Jun 25, 2021
This chart shows countries and territories subject to a temporary CDC dog import ban due to rabies concerns.
More Information
Tokyo 2021 Olympics
Jun 24, 2021
This chart shows opinions on holding the 2020/21 Tokyo Olympics among the Japanese population.
More Information
Tokyo 2020
Jun 24, 2021
This chart compares vaccination progress against COVID-19 in Japan to other countries.
More Information
Climate Change
Jun 24, 2021
This chart shows the risk to Asian cities in the event of a 10-year flood occurring and due to rising sea levels by 2030.
More Information
Immigration
Jun 23, 2021
This chart shows the number of Chinese immigrants in Japan and South Korea and share of the countries' total immigrants (1990-2019).
More Information
5G vs. 4G
Jun 23, 2021
This chart shows reliable 5G and 4G download speeds in selected countries (in Mbps).
More Information
COVID-19 Vaccinations
Jun 23, 2021
This chart shows doses of COVID-19 vaccines administered per 100 of population in selected Asian countries (2021).
More Information
Retail
Jun 23, 2021
This chart shows e-commerce revenue in Europe, by segment from 2018 to 2022.
More Information
Millionaires
Jun 23, 2021
This chart shows the change in the number of millionaires by country between 2019 and 2020.
More Information
Healthcare
Jun 23, 2021
This chart shows the most common non-UK/British nationalities of NHS England staff in 2020.
More Information
Poverty in China
Jun 22, 2021
This chart shows the share of people living under the national and upper-middle income poverty lines in China (in percent).
More Information
Japan
Jun 22, 2021
This chart shows the change in visits to non-essential retail, hospitality and recreation venues in Japan on June 18, 2021 compared...
More Information
Covid-19 Pandemic
Jun 22, 2021
This chart shows the annual number of deaths and years of life lost in the U.S. by cause.
More Information
Motorway Deaths
Jun 22, 2021
This chart shows the annual fatality rate per 1,000 km and general motorway speed limit.
More Information
European Union
Jun 21, 2021
This chart shows the estimated number of violent war-related deaths in Europe since 1800.
More Information
Yoga and Meditation
Jun 21, 2021
This chart shows the most popular yoga, meditation and mindfulness apps in 2021.
More Information
Displaced Persons
Jun 21, 2021
This chart shows the number of displaced people hosted per 1,000 inhabitants in 2020.
More Information
Economy
Jun 18, 2021
This chart shows the forecast increase in the ultra rich's investable wealth from 2020 to 2025.
More Information
Gaming
Jun 18, 2021
This chart shows the share of U.S. gamers who play more than 20 hours per week that say they play certain video game genres in 2021
More Information
Health
Jun 18, 2021
This chart shows the share of people in the UK with a new Covid-19 infection after vaccination, by vaccine type and dose number.
More Information
63
/
161
Contact
Get in touch with us. We are happy to help.
Do you still have questions?
Feel free to contact us anytime using our
contact form
or visit our
FAQ page
.
Your contact to the Infographics Newsroom
Felix Richter
Data Journalist
felix.richter@statista.com
+49 (40) 284 841 557