Skip to main content
Consumer Goods & FMCG
E-Commerce
Economy & Politics
Energy & Environment
Health, Pharma & Medtech
Internet
Media
Technology & Telecommunications
Transportation & Logistics
Travel, Tourism & Hospitality
View all industries
Global data volume growth
Global AI market size
Number of generative AI users worldwide
Global inflation rate
Retail e-commerce sales worldwide
Largest economies worldwide
Biggest social media platforms by users
Global EV market share by manufacturer
International tourist arrivals by world region
Global annual CO₂ emissions
Browse recent statistics
Artificial intelligence (AI) worldwide
TikTok
Nvidia
E-commerce worldwide
Global GDP
Instagram
Apparel market worldwide
Video gaming worldwide
Global renewable energy industry
Influencer marketing worldwide
Browse recent topics
Consumer Trends 2026
Artificial Intelligence: in-depth market analysis
E-commerce challenges
Global economy
TikTok
Luxury goods: in-depth market analysis
Electric vehicles: A global overview
Video gaming worldwide
Travel and tourism trends 2026
Battery recycling worldwide
Browse recent reports
Explore the tool
Explore Classic mode
Advertising & Media
eCommerce
Consumer
Finance
Global Indicators
Health
Industrial
Mobility
Technology
Explore Market Insights
eCommerce Insights
Research AI
Book a demo
All integrations
Developer docs
Explore Statista Connect
Research
Strategy & Consulting
Marketing
Media & PR
Explore AI assistants
Marketing
Research & Development
Strategy
Sales
Find the fact
Tell the story
Win the pitch
Understand the market
Develop your strategy
Academia
Agencies
Consultancies
Consumer goods
Finance
Tech
Research solutions
Strategy consulting
Communication services
Explore Statista+
Statista R
Statista Healthcare
About Statista
First steps & help center
Webinar & training hub
Success stories
Individuals & Small Teams
Businesses & Enterprises
Academia & Government
English
Deutsch
Daily Data
Infographics on the topic "coronavirus"
GDP Growth
Sep 1, 2021
This chart shows India's quarterly GDP growth (year-over-year) since 2012.
More Information
Collaboration software
Sep 1, 2021
The chart shows the market share of companies in the collaboration software segment worldwide.
More Information
EU Travel Zone
Aug 31, 2021
This chart shows countries from where it is allowed to enter the EU and Schengen areas amid the COVID-19 pandemic (as of August 31,...
More Information
COVID-19 Pandemic
Aug 31, 2021
This chart shows average daily COVID-19 cases in U.S. states per 100,000 inhabitants.
More Information
Hate Crimes
Aug 31, 2021
This chart shows the total number of hate crime incidents recorded by the FBI.
More Information
COVID-19 Vaccinations
Aug 30, 2021
This chart shows the share of forecast global GDP losses 2022-25 from vaccine delays by world region and development status (in percent).
More Information
COVID-19 Vaccination
Aug 30, 2021
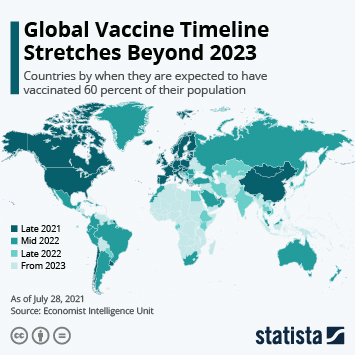
This world map shows countries by when they are expected to have vaccinated 60 percent of their population against COVID-19 (as of...
More Information
Statista Survey
Aug 27, 2021
This chart shows the share of UK respondents who have experienced certain mental health issues in the past 12 months.
More Information
COVID-19 Rental Assistance
Aug 27, 2021
This chart shows cumulative expenditures from the Emergency Rental Assistance Program and total program funding (2021).
More Information
Digital Wellbeing
Aug 25, 2021
This chart shows approximate screen time per day in the UK, US and Germany.
More Information
COVID-19
Aug 20, 2021
This chart shows COVID-19 cases, hospitalizations and deaths among fully vaccinated/not fully vaccinated people in Wisconsin in July...
More Information
Society
Aug 19, 2021
This chart shows the highest shares of people in European countries that think the level of health risk from Covid-19 tends to be overstated...
More Information
Covid-19
Aug 19, 2021
This chart shows the estimated share of the UK population with SARS-CoV-2 antibodies in July 2021, by country.
More Information
COVID-19 Vaccines
Aug 19, 2021
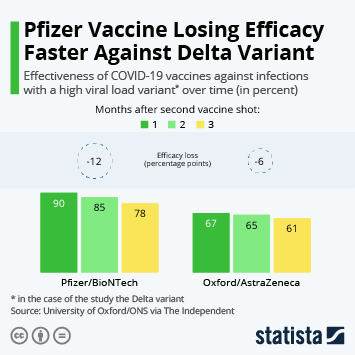
This chart show the effectiveness of COVID-19 vaccines against infections with a high viral load variant over time (in percent).
More Information
Retail Footfall
Aug 18, 2021
This chart shows the percentage change in number of visits to businesses in the U.S. in July/August 2021 compared to the same period...
More Information
COVID-19 Impact on Tourism
Aug 16, 2021
This chart shows the change in international tourist arrivals from January through May 2021 compared to the same period of 2019.
More Information
Economy
Aug 12, 2021
This chart looks at monthly changes in GDP in June 2021 of UK services industries.
More Information
Airlines
Aug 12, 2021
This chart shows revenue of the largest U.S. passenger airlines in Q2 2021.
More Information
Mask Mandates
Aug 12, 2021
This chart shows school mask mandates by U.S. state (as of Aug 10, 2021).
More Information
Manufacturing industry in the UK
Aug 11, 2021
The chart shows UK manufacturers' sales by product category.
More Information
COVID-19 in the U.S.
Aug 10, 2021
This chart shows the number of unvaccinated people and COVID-19 hospitalizations in the best & worst vaccinated U.S. states (as of...
More Information
Covid-19 Vaccine Rollout
Aug 10, 2021
This chart shows the share of residents in U.S. states who are fully vaccinated against Covid-19.
More Information
COVID-19 Outbreak
Aug 6, 2021
This chart shows the number of fully vaccinated Americans who became infected with COVID-19 and were hospitalized or died.
More Information
Delta Variant
Aug 5, 2021
This chart shows the number of Delta variant infections in the previous four weeks and share of total new COVID-19 infections in selected...
More Information
COVID-19
Aug 5, 2021
This chart shows cumulative global COVID-19 cases as of August 4, 2021.
More Information
Healthcare in high-income countries
Aug 5, 2021
The chart shows the ranking of selected countries according to their healthcare system.
More Information
COVID-19 in Japan
Aug 4, 2021
This chart shows the seven-day average of new confirmed COVID-19 cases in Japan.
More Information
Human Hair Exports
Aug 4, 2021
This chart shows the value of human hair and related products exported from India 2015-2020 (in million U.S. dollars).
More Information
Worries
Aug 4, 2021
This chart shows nation's biggest concerns by number of respondents naming them in selected countries (in percent).
More Information
Economic Impact of COVID-19
Aug 3, 2021
This chart shows the Manufacturing Purchasing Managers Index (PMI) of China.
More Information
COVID-19 Pandemic
Aug 3, 2021
This chart shows the seven-day rolling average of newly confirmed COVID-19 cases per million people in the U.S. and the European Union.
More Information
COVID-19 Vaccines
Jul 30, 2021
This chart shows the countries which have fully authorized coronavirus vaccines of Chinese origin (as of July 28, 2021).
More Information
COVID-19 Vaccines
Jul 30, 2021
This chart shows how many Americans have changed their minds on getting a COVID-19 vaccine between January and June 2021.
More Information
Car manufacturing and corona
Jul 29, 2021
The chart shows the cars produced in the UK since its first lockdown per month.
More Information
COVID-19 Travel Restrictions
Jul 27, 2021
This chart shows the countries which have not opened their borders for travelers in the COVID-19 pandemic and regional totals (as of...
More Information
COVID-19 Vaccine Rollout
Jul 26, 2021
This chart shows the seven-day average of COVID-19 vaccine doses administered in the United States.
More Information
U.S. Economy
Jul 20, 2021
This chart shows the length of recessions in the United States since World War II.
More Information
Covid-19 Pandemic
Jul 13, 2021
This chart shows the share of Americans reporting that aspects of their lives have returned to complete normality.
More Information
Covid-19 Pandemic
Jul 12, 2021
This chart shows the share of Israeli Covid-19 cases by age group in the month up to July 05, 2021.
More Information
Covid-19 Pandemic
Jul 12, 2021
This chart shows additional expected U.S. Covid-19 deaths under two scenarios up to June 30, 2021.
More Information
Spending Money
Jul 8, 2021
This chart shows the growth or decline of disposable incomes in OECD and affiliated countries.
More Information
Covid-19
Jul 6, 2021
This chart shows the share of the public which support or oppose the removal of UK lockdown restrictions in the summer of 2021.
More Information
Food Security
Jul 6, 2021
This chart shows cereal import requirements and the number of undernourished people in North Korea.
More Information
Pandemic
Jul 1, 2021
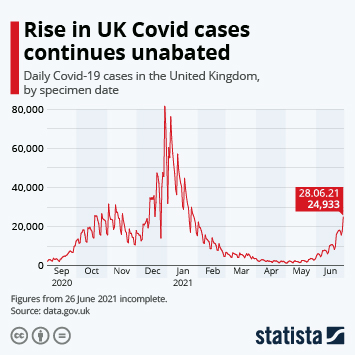
This chart shows the daily reported lab-confirmed Covid-19 cases in the United Kingdom.
More Information
Covid-19 Pandemic
Jun 29, 2021
This chart shows the share who say the EU has done a good job dealing with the coronavirus outbreak.
More Information
Health
Jun 28, 2021
This chart shows the share of people that say they have confidence in their own country's health care system to handle a future pandemic.
More Information
Pandemic
Jun 25, 2021
This chart shows the average change in minutes spent on activities per day in Great Britain (28 Mar-26 Apr 2020 to 20-28 Mar 2021).
More Information
Tokyo 2021 Olympics
Jun 24, 2021
This chart shows opinions on holding the 2020/21 Tokyo Olympics among the Japanese population.
More Information
Tokyo 2020
Jun 24, 2021
This chart compares vaccination progress against COVID-19 in Japan to other countries.
More Information
Immigration
Jun 23, 2021
This chart shows the number of Chinese immigrants in Japan and South Korea and share of the countries' total immigrants (1990-2019).
More Information
COVID-19 Vaccinations
Jun 23, 2021
This chart shows doses of COVID-19 vaccines administered per 100 of population in selected Asian countries (2021).
More Information
Covid-19 Pandemic
Jun 22, 2021
This chart shows the annual number of deaths and years of life lost in the U.S. by cause.
More Information
Yoga and Meditation
Jun 21, 2021
This chart shows the most popular yoga, meditation and mindfulness apps in 2021.
More Information
WFH
Jun 16, 2021
This chart shows the share of Japanese working from home during the COVID-19 pandemic (2020-2021).
More Information
U.S.-Mexico Border
Jun 10, 2021
This chart shows monthly number of children and individuals in family units detained at the U.S.-Mexico border in FY19/20/21.
More Information
Pandemic
Jun 9, 2021
This chart shows public attitudes in England to potential easing of Covid restrictions in June 2021.
More Information
COVID-19 in India
Jun 8, 2021
This chart shows survey results about COVID-19 and fake news in India (2020).
More Information
Coronavirus
Jun 4, 2021
This chart shows the estimated share of the England population age groups testing positive for Covid-19 (week ending 29 May 2021).
More Information
COVID-19
Jun 2, 2021
This chart shows the rolling 7-day average of new COVID-19 cases per one million of population in the most affected Asian countries...
More Information
Tokyo Olympic Summer Games
Jun 2, 2021
This chart shows facts and figures about the Olympic Summer Games 2020/21 in Tokyo.
More Information
Covid-19
Jun 2, 2021
This chart shows growth in healthcare expenditure in the UK from 1998 to 2020.
More Information
COVID-19
Jun 2, 2021
This chart shows the countries with the highest month-to-month increase in oxygen need between April and May 2021.
More Information
Brazil
Jun 2, 2021
This chart shows the effects on Serrana when 75% of its inhabitants were fully vaccinated with CoronaVac*
More Information
Mobility
May 28, 2021
This chart shows the revenue growth of selected modes of transportation worldwide in 2019, 2020 and 2021 (in percent).
More Information
Economy
May 27, 2021
This chart shows the change in total UK goods imports from top five import partners from Q1 2018 to Q1 2021.
More Information
GDP Growth
May 27, 2021
This chart shows 2021 Q1 GDP growth in selected countries.
More Information
COVID-19 Vaccines
May 26, 2021
This chart shows COVID-19 vaccine candidates by clinical trial phase and national origin (as of May 25, 2021).
More Information
COVID-19 in India
May 26, 2021
This chart shows the share of respondents among Urban Indians saying the following worried them as a result of the COVID-19 pandemic.
More Information
Economy
May 25, 2021
This chart shows UK public sector net borrowing excluding public sector banks from 1993 to 2021.
More Information
Covid-19 Pandemic
May 19, 2021
This chart shows the number of vaccine doses produced and exported as of March 2021.
More Information
COVID-19
May 19, 2021
This chart shows the index of the rise and fall of daily new COVID-19 cases/deaths (7-day rolling average) in India (2021).
More Information
COVID-19
May 17, 2021
This chart shows the 7-day rolling average of new COVID-19 cases per million of population in selected Asian countries/territories...
More Information
Politics
May 17, 2021
This chart represents government approval rates in the United Kingdom.
More Information
Beauty Pageants
May 17, 2021
This chart shows the countries with the most Big Four international beauty pageant titles.
More Information
Covid-19 Pandemic
May 17, 2021
This chart shows Covid-19 vaccination doses administered per 100 people.
More Information
India Travel Ban
May 12, 2021
This chart shows countries banning entry from India to their territories (as of May 12, 2021).
More Information
COVID-19
May 12, 2021
This chart shows the cumulative reported deaths and estimated actual deaths from COVID-19 in the most affected countries (2020-2021).
More Information
COVID-19 Vaccinations
May 11, 2021
This chart show the start date of coronavirus vaccination campaigns or doses administered per 100 of population in Asia (2021).
More Information
Olympic Games
May 11, 2021
This chart provides an overview of all 32 Summer Olympic Games scheduled/held since 1896.
More Information
Covid-19 Outbreak
May 10, 2021
This chart shows the share favoring/opposing businesses requiring proof of Covid-19 vaccination to do the following.
More Information
Covid-19
May 6, 2021
This chart shows the share of the public that think certain Covid-19 vaccines are somewhat/very safe.
More Information
Covid-19 Outbreak
May 6, 2021
This chart shows the top sources of Covid-19 vaccine funding as of March 2021 (in U.S. dollars).
More Information
COVID-19
May 5, 2021
This chart shows the countries with the highest increase in new confirmed COVID-19 deaths between April 20 and May 4, 2021.
More Information
COVAX
May 5, 2021
This chart shows donations to COVAX-AMC.
More Information
Covid-19 pandemic
May 5, 2021
This chart shows U.S. healthcare worker deaths from Covid-19 by state up to April 07, 2021.
More Information
Covid-19 Outbreak
May 5, 2021
This chart shows the share of people saying their country's Covid-19 response has been very difficult to cope with.
More Information
Covid-19 Outbreak
May 4, 2021
This chart shows the share of the population unwilling to take a Covid-19 vaccine in selected countries in 2020.
More Information
COVID-19
May 4, 2021
This chart shows U.S. states which have rolled back COVID-19 restrictions.
More Information
COVID-19
May 3, 2021
This chart shows the low and middle income countries with the highest daily demand of medical oxygen to treat COVID-19 (in cylinders*).
More Information
COVID-19
Apr 30, 2021
This chart shows the 7-day rolling average of daily new COVID-19 cases per million of population in selected European countries (2021).
More Information
6
/
15
Contact
Get in touch with us. We are happy to help.
Do you still have questions?
Feel free to contact us anytime using our
contact form
or visit our
FAQ page
.
Your contact to the Infographics Newsroom
Felix Richter
Data Journalist
felix.richter@statista.com
+49 (40) 284 841 557