Skip to main content
Consumer Goods & FMCG
E-Commerce
Economy & Politics
Energy & Environment
Health, Pharma & Medtech
Internet
Media
Technology & Telecommunications
Transportation & Logistics
Travel, Tourism & Hospitality
View all industries
Global data volume growth
Global AI market size
Number of generative AI users worldwide
Global inflation rate
Retail e-commerce sales worldwide
Largest economies worldwide
Biggest social media platforms by users
Global EV market share by manufacturer
International tourist arrivals by world region
Global annual CO₂ emissions
Browse recent statistics
Artificial intelligence (AI) worldwide
TikTok
Nvidia
E-commerce worldwide
Global GDP
Instagram
Apparel market worldwide
Video gaming worldwide
Global renewable energy industry
Influencer marketing worldwide
Browse recent topics
Consumer Trends 2026
Artificial Intelligence: in-depth market analysis
E-commerce challenges
Global economy
TikTok
Luxury goods: in-depth market analysis
Electric vehicles: A global overview
Video gaming worldwide
Travel and tourism trends 2026
Battery recycling worldwide
Browse recent reports
Explore the tool
Explore Classic mode
Advertising & Media
eCommerce
Consumer
Finance
Global Indicators
Health
Industrial
Mobility
Technology
Explore Market Insights
eCommerce Insights
Research AI
Book a demo
All integrations
Developer docs
Explore Statista Connect
Research
Strategy & Consulting
Marketing
Media & PR
Explore AI assistants
Marketing
Research & Development
Strategy
Sales
Find the fact
Tell the story
Win the pitch
Understand the market
Develop your strategy
Academia
Agencies
Consultancies
Consumer goods
Finance
Tech
Research solutions
Strategy consulting
Communication services
Explore Statista+
Statista R
Statista Healthcare
About Statista
First steps & help center
Webinar & training hub
Success stories
Individuals & Small Teams
Businesses & Enterprises
Academia & Government
English
Deutsch
Daily Data
Infographics on the topic "statista trend"
Sponsored post by Booking.com
Aug 2, 2024
This infographic shows the US hotel room share in 1990 compared to 2022, by accommodation type
More Information
Mining
Jul 31, 2024
This chart shows the top countries by share in global processing of selected critical minerals in 2023.
More Information
Aviation industry
Jul 26, 2024
This chart shows selected economical indicators of American, Delta, Southwest and United.
More Information
Emissions
Jul 23, 2024
This chart shows the estimated life-cycle greenhouse gas emissions of electronic devices in 2020.
More Information
Semiconductor manufacturing
Jul 19, 2024
This chart shows selected financial indicators of the seminconductor foundry company TSMC.
More Information
Plastic
Jul 12, 2024
This chart shows national-level regulation to ban/limit the use of plastic bags (2024).
More Information
Commerical real estate
Jul 11, 2024
This chart shows the vacancies in the U.S. office real estate sector by quarter in percent.
More Information
Monsoon
Jul 10, 2024
This chart shows daily rainfall over India in June and July (in mm/m²).
More Information
Inequality
Jul 10, 2024
This chart shows the wealth inequality index scores in 2023 and change since 2008 in selected countries.
More Information
Global health
Jun 24, 2024
This chart shows the maternal deaths per 100,000 live births in select countries for 2020.
More Information
Forced labor & human trafficking
Jun 20, 2024
This chart shows the estimated number of children age 5-17 in child labor in regions with highest prevalence.
More Information
Podcasting
Jun 20, 2024
This chart shows estimated podcast advertising spending worldwide from 2017 to 2027.
More Information
Reuters Institute Digital News Report 2024
Jun 17, 2024
This chart shows the share of respondents in selected countries who use TikTok for news (in %).
More Information
Online news
Jun 17, 2024
This chart shows people's main gateway to online news in 2024.
More Information
Sponsored post by Booking.com
Jun 11, 2024
This infographic shows the share of European hotels that are able to access funding with and without difficulty in Europe, by number...
More Information
Tipping
Jun 7, 2024
This chart shows the share of respondents who say tipping should not be expected.
More Information
Sponsored post by Booking.com
Jun 7, 2024
This infographic shows the share of European hoteliers who observed selected behavior trends, by accommodation type
More Information
Tourism
May 27, 2024
This chart shows the cities in the world with the most visitors in 2017.
More Information
Eurovision Song Contest
May 10, 2024
This chart shows the viewing figures for the Eurovision Song Contest on public service media channels.
More Information
Tablet market
May 7, 2024
This chart shows global tablet shipments since 2010.
More Information
Impact of COVID-19 Pandemic on Mental Health
Apr 30, 2024
This chart shows the percentage of U.S. adults showing symptoms of anxiety and/or depressive disorder before and during the Covid-19...
More Information
Mental health
Apr 30, 2024
This chart shows the results of a survey on mental health issues in the United States.
More Information
Hydropower
Apr 4, 2024
This chart shows the year-on-year change in global hydropower generation.
More Information
Reddit
Mar 14, 2024
This chart shows the share of regular social media users who use the following platforms regularly (in %).
More Information
Liberal or conservative?
Feb 15, 2024
This chart shows the share of respondents who describe themselves as very liberal/liberal, by age and gender (in percent).
More Information
STIs
Feb 13, 2024
This chart shows the reported number of confirmed cases of gonorrhoea, syphilis and chlamydia in 2015 and 2022 in the EU/EEA.
More Information
U.S. Southern Border
Feb 12, 2024
This chart shows the number of migrants apprehended and migrants deemed inadmissible at the Southern U.S. border.
More Information
Google
Jan 31, 2024
This chart shows Alphabet's year-over-year percent change in revenue per quarter.
More Information
Virtual, Alternate and Mixed Reality
Jan 19, 2024
This chart shows the share of respondents who get excited about VR and AR headsets.
More Information
Marriage
Dec 15, 2023
This chart shows the share of U.S. adults who have never been married.
More Information
Sportswear
Dec 7, 2023
This chart shows annual sales of selected publicly traded sportswear companies since 2000.
More Information
Cost Of Living
Dec 7, 2023
This chart shows the cities worldwide with the highest cost of living in 2023.
More Information
PISA 2022
Dec 6, 2023
This chart shows the PISA 2022 national scores of 15y/o pupils for core subjects and change since 2018.
More Information
International Day of Banks
Dec 4, 2023
This chart shows the share of mobile bankers, by country.
More Information
Black Friday
Nov 23, 2023
This chart shows how global Google searches for the term "Black Friday" have increased over the years.
More Information
Black Friday
Nov 20, 2023
This chart shows the share of respondents who plan on buying something in the following categories on Black Friday and Cyber Monday.
More Information
Crime
Nov 17, 2023
This chart shows annual offenses per 100,000 people in the violent crime and property crime categories in the U.S. (2012-2022).
More Information
Shoplifting
Nov 17, 2023
This chart shows the number of shoplifting incidents per 100,000 people in selected U.S. cities.
More Information
Fintech
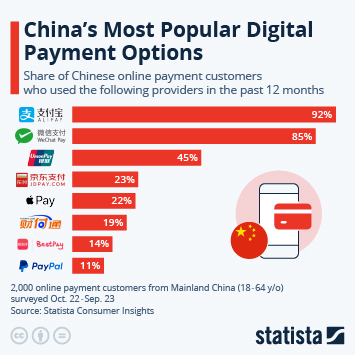
Nov 16, 2023
This chart shows the most popular digital payment services in China in 2023.
More Information
Sponsored post by Booking.com
Oct 19, 2023
This infographic shows the spending habits that European hoteliers have noticed in their guests.
More Information
Remote Work
Oct 19, 2023
This chart shows the country rankings according to the Global Remote Work Index 2023.
More Information
Sponsored post by Booking.com
Oct 19, 2023
This infographic shows aspects of food and drink that are becomming more important for accommodation businesses.
More Information
Climate Change
Oct 11, 2023
This chart shows monthly temperature divergence in selected years from a multiyear average (1980-2015), serving as a reference period.
More Information
Energy
Oct 11, 2023
This chart shows the volume of global fossil fuel subsidies from 2015 to 2022.
More Information
World Mental Health Day
Oct 10, 2023
This chart shows the share of U.S. adults who say the following illnesses are the biggest health problems facing people in the country...
More Information
Reality TV
Sep 28, 2023
This chart shows the share of TV/streaming viewers in selected countries who said they watched reality TV (in percent).
More Information
Defense
Sep 26, 2023
This chart shows the estimated annual change in global nuclear warhead stockpiles from 2009 to 2023.
More Information
Blockchain
Sep 15, 2023
This chart shows Google Search interest in 'NFT' from 2000 to 2023.
More Information
Wealth
Sep 11, 2023
This chart shows the share of ultra high net worth individuals, by region (in percent).
More Information
Car industry
Sep 7, 2023
This chart shows the share of respondents in selected countries who say it is important to own a car.
More Information
National Thrift Store Day
Aug 17, 2023
This chart shows the share of respondents who have bought something second-hand in the past 12 months.
More Information
mental health
Aug 7, 2023
This chart shows the share of veterans who have considered taking their own lives before and after joining the U.S. military.
More Information
Religion
Aug 2, 2023
This chart shows the share of U.S. respondents who say they believe in five different spiritual entities.
More Information
NHS 75 year anniversary
Jul 5, 2023
This chart shows the share of respondents who are satisfied/dissatisfied with how the UK's NHS is running.
More Information
meat consumption by type
Jul 3, 2023
This chart shows the share of respondents in selected countries who purchased the following types of meat in the past month.
More Information
Food
Jul 3, 2023
This chart shows the worldwide annual production of meat.
More Information
North Korea trade
Jun 26, 2023
This graphic shows the share of North Korean imports and exports, by origin/destination in 2017 and 2022.
More Information
Sponsored post by Booking.com
Jun 20, 2023
This graphic shows that chain hotels have a more positive business sentiment when compared to independent properties in Europe.
More Information
Climate Change
Jun 15, 2023
This chart shows the extent of arctic sea ice since 1980.
More Information
Apparel
Jun 1, 2023
This chart shows the share of worldwide apparel revenue accounted for by online and secondhand sales.
More Information
Layoffs
May 24, 2023
This chart shows the Indian companies in the tech/startup sector with the highest number of workers laid off in 2022 and 2023.
More Information
conversion therapy
May 17, 2023
This map shows where conversion therapy was banned in the world in 2020.
More Information
WORLD TELECOMMUNICATION AND INFORMATION SOCIETY DAY
May 17, 2023
This chart shows the internet penetration rate in India.
More Information
LGBTQ+ Identification in the UK
May 16, 2023
This chart shows the share of UK respondents who consider themselves part of the LGBTQ+ community, by age group.
More Information
AI
May 11, 2023
This chart shows how often the term "AI" was mentioned during the latest earnings calls of big tech companies.
More Information
Russia-Ukraine War
May 9, 2023
This chart shows where different countries stand in terms of Russia, as of March 2023.
More Information
Traffic Deaths
May 4, 2023
This chart shows average annual pedestrian deaths per 100,000 people in U.S. states and the most affected metro areas (2016-2020).
More Information
U.S. Banking Crisis
May 2, 2023
This chart shows the number of FDIC-insured commercial banks and their total branches in the United States.
More Information
Income Classes
Apr 28, 2023
This chart shows the share of people and aggregate income associated with U.S. income classes in 1970/71 and 2021 (in percent).
More Information
Payment Methods
Apr 28, 2023
Share of respondents in selected countries who used the following methods of payment in the last 12 months (2023).
More Information
Wealth
Apr 18, 2023
This chart compares countries according to the World Happiness Index 2023 and GDP per capita.
More Information
Brazil-China
Apr 13, 2023
This chart shows Brazil's goods imports from and exports to China.
More Information
Migration
Apr 13, 2023
This chart shows recorded migrant deaths by region (2014-2022).
More Information
Interest vs. Inflation
Apr 11, 2023
This chart shows real interest rates in advanced and emerging market/developing economies (in percent).
More Information
Shoppi
Mar 31, 2023
This chart shows the share of consumers that have purchased clothes second hand in the past 12 months.
More Information
World Water Day
Mar 22, 2023
This chart shows the share of domestic wastewater flow safely treated by region in 2020.
More Information
Dogs
Mar 16, 2023
This chart shows the top dog breeds registered in the U.S. in 2004, 2014 and 2024.
More Information
Media
Jan 30, 2023
This chart shows forecast growth in global digital audio revenue, by segment, from 2018 to 2027.
More Information
Microsoft
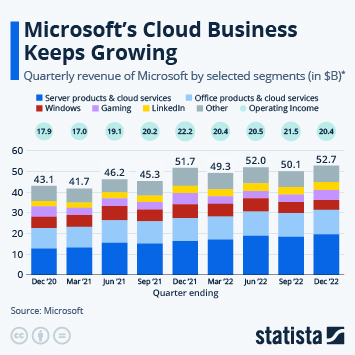
Jan 25, 2023
This chart shows the quarterly revenue of Microsoft by selected segments.
More Information
Medical marajuana
Jan 24, 2023
This chart shows the share of people in selected countries that would be open to taking medical cannabis for treatment.
More Information
Sponsored post by Booking.com
Jan 17, 2023
This infographic shows that share of travel accommodation sales in Europe, by location.
More Information
Climate Change
Jan 13, 2023
This chart shows global ocean surface temperatures from 1880 to 2022 as a divergence from the 20th century average.
More Information
U.S. Labor Market
Jan 9, 2023
This video shows how the “Great Resignation” unfolded and which industries have been most affected by the trend.
More Information
Sponsored post by Booking.com
Dec 12, 2022
This infographic shows the number of international tourist arrivals by destination region from 1990 to 2021
More Information
Health
Nov 29, 2022
This chart shows the share of 18-29 year old U.S. adults that said they had smoked cigarettes in the past week.
More Information
Climate Change
Nov 23, 2022
This chart shows countries ranked by their climate protection performance according to the Climate Change Performance Index 2023.
More Information
Global Wealth
Nov 21, 2022
This chart shows the share of wealth held by the wealthiest 1 percent of the population in 2000 and 2021 in selected countries.
More Information
Fish and seafood consumption
Nov 21, 2022
This chart shows estimated per capita consumption of fish and seafood in selected countries in 2019.
More Information
U.S. Governors
Nov 15, 2022
This chart shows the number of Democratic and Republican governors between 1990 and 2023.
More Information
homocide in the U.S.
Nov 2, 2022
This chart shows the rate of homicides that go unsolved in the U.S.
More Information
4
/
7
Contact
Get in touch with us. We are happy to help.
Do you still have questions?
Feel free to contact us anytime using our
contact form
or visit our
FAQ page
.
Your contact to the Infographics Newsroom
Felix Richter
Data Journalist
felix.richter@statista.com
+49 (40) 284 841 557