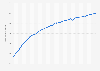
In the second quarter of 2021, leading mobile conferencing platforms Zoom, Microsoft Teams, and Google Meet were reported to have close to 200 million downloads of their apps from users worldwide. This represents a decrease of more than 58 percent compared to the corresponding quarter in the previous year, when Zoom, Microsoft Teams, and Google Meet collectively amassed 479 million installs.
Cumulative installs of leading video conferencing apps Zoom, Microsoft Teams, and Google Meet worldwide from 1st quarter 2020 to 2nd quarter 2021 (in millions)
Basic Account
Get to know the platform
You only have access to basic statistics.
This statistic is not included in your account.
Starter Account
The ideal entry-level account for individual users
- Instant access to 1m statistics
- Download in XLS, PDF & PNG format
- Detailed references
$149 USD / Month *
Professional Account
Full access
Business Solutions including all features.
* Prices do not include sales tax.
Other statistics that may interest you Mobile messenger and communication apps
Overview
5
- Premium Statistic Mobile internet penetration rate worldwide 2022
- Basic Statistic Media usage in an online minute 2022
- Premium Statistic Most popular smartphone activities for global users 2022-2023
- Basic Statistic Share of app user engagement worldwide 2020-2022, by category
- Premium Statistic Global number of mobile messaging app users 2022-2030
Benchmark
6
- Premium Statistic Global market share of selected mobile messaging apps 2019-2022
- Premium Statistic Most popular Google Play app categories 2022
- Basic Statistic Most popular Apple App Store categories 2022
- Basic Statistic Most popular global mobile messaging apps 2023
- Basic Statistic Most popular messenger apps worldwide 2023, by downloads
- Basic Statistic Most popular messenger apps worldwide 2023, by IAP revenue
Usage and reach
8
- Premium Statistic Instant messaging and communication apps global MAU 2022
- Premium Statistic Instant messaging and communication apps global DAU 2022
- Premium Statistic Instant messaging and communication apps daily opens 2022
- Premium Statistic Share of messaging and communication apps global users active daily 2022
- Premium Statistic Most used messenger by brand in the U.S. 2023
- Premium Statistic Reach of most popular U.S. smartphone apps 2023
- Premium Statistic Mobile video calls usage reach worldwide 2023, by region
- Basic Statistic Mobile video call usage reach 2023, by age and gender
Mainstream messengers
8
- Premium Statistic Monthly global unique WhatsApp users 2020-2023
- Premium Statistic Yearly growth of user engagement on WhatsApp in selected markets 2022
- Premium Statistic WhatsApp: monthly usage in selected markets Q3 2022
- Basic Statistic Global WhatsApp iOS downloads Q2 2022, by region
- Basic Statistic Global WhatsApp Google Play downloads Q2 2022, by region
- Basic Statistic Annual global app downloads of Facebook Messenger 2015-2022
- Premium Statistic Global IAP revenue of Facebook Messenger 2017-2023
- Premium Statistic U.S. Facebook Messenger users 2023, by age group
Privacy focus
6
- Basic Statistic Telegram global downloads 2023, by region
- Basic Statistic Most popular Telegram channel categories 2023
- Premium Statistic Telegram user distribution 2023, by age group
- Premium Statistic Telegram Premium subscribers worldwide 2022
- Basic Statistic Signal global downloads 2020-2023, by region
- Basic Statistic Growth of Telegram and Signal DAU in Ukraine and Russia 2022
Regional spotlight: Messaging apps in China and East Asia
7
- Premium Statistic Monthly active users of leading messaging apps in China 2023
- Premium Statistic Number of active WeChat messenger accounts Q3 2013-Q3 2023
- Premium Statistic Number of monthly active smart devices of Tencent QQ 2014-2022
- Premium Statistic Monthly app downloads of LINE in Japan 2022
- Premium Statistic Most used mobile messaging apps South Korea 2022
- Premium Statistic Number of monthly active users of KakaoTalk in South Korea 2015-2022
- Premium Statistic Kakaotalk number of monthly active users worldwide 2013-2022, by quarter
Video call and conferencing apps
4
- Basic Statistic Zoom mobile app global downloads as of Q2 2023, by region
- Basic Statistic Microsoft Teams mobile app global downloads as of Q2 2023, by region
- Premium Statistic Global usage of video calls by professionals for work 2022, by age and gender
- Premium Statistic Video call fatigue in the U.S. and UK 2022, by type of call
Spotlight: Messenger apps for work
7
- Premium Statistic Global communication tools and channels used for work 2022, by frequency
- Premium Statistic Messenger apps global audience usage for work 2022, by age and gender
- Premium Statistic Global usage of video calls by professionals for work 2022, by age and gender
- Premium Statistic Channels consumers use to contact brands in the U.S. 2022
- Basic Statistic WhatsApp Business global downloads 2018-2022
- Premium Statistic WhatsApp Business: average revenue per user 2022, by region
- Premium Statistic Global WhatsApp Business revenues 2022, by region
Further related statistics
20
- U.S. adults that would use an app to track illness 2017, by community
- Mobile app user retention rate worldwide 2019, by country
- U.S. adults that would use an app for health emergencies by community 2017
- U.S. adults who would use an app to track COVID-19 exposure in April 2020
- U.S. health workers that would use an app for health emergencies 2017
- U.S. adults that would use an app to track diet and nutrition 2017, by gender
- U.S. adults that use an app to track fitness 2017, by ethnicity
- U.S. health workers that use an app to get fitness instructions 2017
- Game elements used in multiple sclerosis health apps 2017
- U.S. adults that would use an app to track diet and nutrition 2017, by age
- U.S. app installation and usage 2016, by device
- U.S. adults that use an app to track fitness 2017, by age
- U.S. adults that use an app to get fitness instructions 2017, by community
- Most prevalent features of multiple sclerosis health apps 2017
- U.S. daily smartphone and tablet app usage 2016
- Projected size of the global emergency lighting market 2016-2023
- Global gross profit margin of Games Workshop in 2017 to 2023
- Median expenses of HNW collectors on art worldwide 2019-H1 2021, by generation
- Global mean sea level rise 1901-2018
- Animal global wound care market size 2016-2024
Further Content: You might find this interesting as well
Statistics
- U.S. adults that would use an app to track illness 2017, by community
- Mobile app user retention rate worldwide 2019, by country
- U.S. adults that would use an app for health emergencies by community 2017
- U.S. adults who would use an app to track COVID-19 exposure in April 2020
- U.S. health workers that would use an app for health emergencies 2017
- U.S. adults that would use an app to track diet and nutrition 2017, by gender
- U.S. adults that use an app to track fitness 2017, by ethnicity
- U.S. health workers that use an app to get fitness instructions 2017
- Game elements used in multiple sclerosis health apps 2017
- U.S. adults that would use an app to track diet and nutrition 2017, by age
- U.S. app installation and usage 2016, by device
- U.S. adults that use an app to track fitness 2017, by age
- U.S. adults that use an app to get fitness instructions 2017, by community
- Most prevalent features of multiple sclerosis health apps 2017
- U.S. daily smartphone and tablet app usage 2016
- Projected size of the global emergency lighting market 2016-2023
- Global gross profit margin of Games Workshop in 2017 to 2023
- Median expenses of HNW collectors on art worldwide 2019-H1 2021, by generation
- Global mean sea level rise 1901-2018
- Animal global wound care market size 2016-2024
Sensor Tower. (July 29, 2021). Cumulative installs of leading video conferencing apps Zoom, Microsoft Teams, and Google Meet worldwide from 1st quarter 2020 to 2nd quarter 2021 (in millions) [Graph]. In Statista. Retrieved December 06, 2023, from https://www.statista.com/statistics/1263757/zoom-microsoft-teams-and-google-meet-global-app-installs/
Sensor Tower. "Cumulative installs of leading video conferencing apps Zoom, Microsoft Teams, and Google Meet worldwide from 1st quarter 2020 to 2nd quarter 2021 (in millions)." Chart. July 29, 2021. Statista. Accessed December 06, 2023. https://www.statista.com/statistics/1263757/zoom-microsoft-teams-and-google-meet-global-app-installs/
Sensor Tower. (2021). Cumulative installs of leading video conferencing apps Zoom, Microsoft Teams, and Google Meet worldwide from 1st quarter 2020 to 2nd quarter 2021 (in millions). Statista. Statista Inc.. Accessed: December 06, 2023. https://www.statista.com/statistics/1263757/zoom-microsoft-teams-and-google-meet-global-app-installs/
Sensor Tower. "Cumulative Installs of Leading Video Conferencing Apps Zoom, Microsoft Teams, and Google Meet Worldwide from 1st Quarter 2020 to 2nd Quarter 2021 (in Millions)." Statista, Statista Inc., 29 Jul 2021, https://www.statista.com/statistics/1263757/zoom-microsoft-teams-and-google-meet-global-app-installs/
Sensor Tower, Cumulative installs of leading video conferencing apps Zoom, Microsoft Teams, and Google Meet worldwide from 1st quarter 2020 to 2nd quarter 2021 (in millions) Statista, https://www.statista.com/statistics/1263757/zoom-microsoft-teams-and-google-meet-global-app-installs/ (last visited December 06, 2023)
Cumulative installs of leading video conferencing apps Zoom, Microsoft Teams, and Google Meet worldwide from 1st quarter 2020 to 2nd quarter 2021 (in millions) [Graph], Sensor Tower, July 29, 2021. [Online]. Available: https://www.statista.com/statistics/1263757/zoom-microsoft-teams-and-google-meet-global-app-installs/