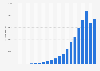
In 2022, the number of ad impressions delivered across Meta's Family of Apps (FoA) (Facebook, Messenger, Instagram and WhatsApp) increased by 18 percent compared to the number reported a year earlier. In 2021, the number increased by 10 percent.
Change in Meta in-app ad impressions worldwide in 2021 and 2022
Basic Account
Get to know the platform
You only have access to basic statistics.
This statistic is not included in your account.
Starter Account
The ideal entry-level account for individual users
- Instant access to 1m statistics
- Download in XLS, PDF & PNG format
- Detailed references
$69 USD $49 USD / Month *
in the first 12 months
Professional Account
Full access
Business Solutions including all features.
* Prices do not include sales tax.
Other statistics that may interest you
Overview
4
Company
8
- Basic Statistic Meta: annual revenue 2009-2022, by segment
- Basic Statistic Meta: annual advertising revenue worldwide 2009-2022
- Basic Statistic Meta: annual marketing expenditure worldwide 2010-2022
- Basic Statistic Meta annual ad spend 2014-2022
- Basic Statistic Meta: annual EBIT 2008-2022
- Basic Statistic Meta: annual net income 2018-2022
- Basic Statistic Meta: worldwide quarterly revenue 2011-2023
- Basic Statistic Meta: worldwide quarterly revenue 2020-2023, by segment
Benchmark
7
- Basic Statistic Market value of the largest internet companies worldwide 2023
- Basic Statistic Market capitalization of the largest U.S. internet companies 2023
- Basic Statistic Global market capitalization of metaverse, Facebook and gaming 2021
- Basic Statistic Most valuable brands worldwide 2022
- Premium Statistic Biggest revenue source of leading tech companies 2022
- Premium Statistic Workforce of leading global online companies 2014-2022
- Basic Statistic Internet companies ranked by revenue 2017-2022
Segment - Family of Apps
8
- Basic Statistic Meta: monthly active product family users 2023
- Basic Statistic Meta: daily active product family users 2023
- Basic Statistic Meta: average revenue per user 2011-2022
- Basic Statistic Facebook: quarterly number of MAU (monthly active users) worldwide 2008-2023
- Basic Statistic Facebook: number of daily active users worldwide 2011-2023
- Basic Statistic Countries with the most Instagram users 2023
- Premium Statistic Most downloaded social media apps worldwide 2022
- Basic Statistic Most downloaded Meta Platforms apps worldwide 2022
Segment - Reality Labs
5
- Basic Statistic Meta: annual Reality Labs revenue 2019-2022
- Basic Statistic Meta: annual Reality Labs operating income/loss 2019-2022
- Premium Statistic XR headset shipment share worldwide Q1 2020-Q2 2022, by brand
- Premium Statistic Comparison of VR headsets worldwide 2023, by price
- Basic Statistic Meta Quest mobile app global downloads 2018-2022
Public opinion
6
- Basic Statistic U.S. adults who have a favorable impression of Facebook 2022
- Basic Statistic U.S. adults who have a favorable impression of Facebook 2022, by age group
- Basic Statistic U.S. adults who have a favorable impression of Facebook 2022, by gender
- Basic Statistic U.S. internet users who think social media is good or bad for society 2022
- Basic Statistic U.S. internet users who think social media is good or bad for society 2022, by age
- Basic Statistic U.S. adult interest in Meta's VR project metaverse 2021
Outlook: the metaverse
7
- Basic Statistic U.S. adults who have heard of the metaverse 2022
- Basic Statistic U.S. adults who have heard of the metaverse 2022, by generation
- Basic Statistic U.S. adults brands most associated with the metaverse 2022
- Basic Statistic U.S. adults descriptions of the metaverse 2022
- Premium Statistic Global interest in metaverse experiences 2022, by generation
- Premium Statistic U.S. adults who have heard of Horizon Worlds 2022
- Basic Statistic Global active users of Meta Horizon Worlds VR platform 2022
Further Content: You might find this interesting as well
Meta Platforms. (February 1, 2023). Change in Meta in-app ad impressions worldwide in 2021 and 2022 [Graph]. In Statista. Retrieved June 07, 2023, from https://www.statista.com/statistics/1364844/change-meta-in-app-ad-impressions/
Meta Platforms. "Change in Meta in-app ad impressions worldwide in 2021 and 2022." Chart. February 1, 2023. Statista. Accessed June 07, 2023. https://www.statista.com/statistics/1364844/change-meta-in-app-ad-impressions/
Meta Platforms. (2023). Change in Meta in-app ad impressions worldwide in 2021 and 2022. Statista. Statista Inc.. Accessed: June 07, 2023. https://www.statista.com/statistics/1364844/change-meta-in-app-ad-impressions/
Meta Platforms. "Change in Meta In-app Ad Impressions Worldwide in 2021 and 2022." Statista, Statista Inc., 1 Feb 2023, https://www.statista.com/statistics/1364844/change-meta-in-app-ad-impressions/
Meta Platforms, Change in Meta in-app ad impressions worldwide in 2021 and 2022 Statista, https://www.statista.com/statistics/1364844/change-meta-in-app-ad-impressions/ (last visited June 07, 2023)
Change in Meta in-app ad impressions worldwide in 2021 and 2022 [Graph], Meta Platforms, February 1, 2023. [Online]. Available: https://www.statista.com/statistics/1364844/change-meta-in-app-ad-impressions/