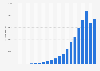
- Internet›
- Social Media & User-Generated Content›
Facebook: worldwide quarterly revenue 2011-2018
Facebook's global revenue as of 4th quarter 2018 (in million U.S. dollars)

Revenue in million U.S. dollars | |
---|---|
Q4 '18 | 16,914 |
Q3 '18 | 13,727 |
Q2 '18 | 13,231 |
Q1 '18 | 11,966 |
Q4 '17 | 12,972 |
Q3 '17 | 10,328 |
Q2 '17 | 9,321 |
Q1 '17 | 8,032 |
Q4 '16 | 8,809 |
Q3 '16 | 7,011 |
Q2 '16 | 6,436 |
Q1 '16 | 5,382 |
Q4 '15 | 5,841 |
Q3 '15 | 4,501 |
Q2 '15 | 4,042 |
Q1 '15 | 3,543 |
Q4 '14 | 3,851 |
Q3 '14 | 3,203 |
Q2 '14 | 2,910 |
Q1 '14 | 2,502 |
Q4 '13 | 2,585 |
Q3 '13 | 2,016 |
Q2 '13 | 1,813 |
Q1 '13 | 1,458 |
Q4 '12 | 1,585 |
Q3 '12 | 1,262 |
Q2 '12 | 1,184 |
Q1 '12 | 1,058 |
Q4 '11 | 1,131 |
© Statista 2019
About this statistic
Show source
Please be patient - this may take a moment
Description
Source
More information
- Show sources information
- Show publisher information
- Release date
- January 2019
- Region
- Worldwide
- Survey time period
- Q4 2011 to Q4 2018
- Region
- Worldwide
- Survey time period
- Q4 2011 to Q4 2018
You only have access to basic statistics.
- Instant access to 1m statistics
- Download in XLS, PDF & PNG format
- Detailed references
$49 / Month *
Corporate solution including all features.
Prices do not include sales tax.


All Information
in one Presentation
- 124 page/s
- English
- pptx
- Detailed references
Everything On "Facebook" in One Document: Edited and Divided into Handy Chapters. Including Detailed References.
I think of Statista as Google for researchers. Statista provides you with the information you search for right away.Dr. Horst Stipp
EVP, Research & Innovation, Advertising Research Foundation
- Company Overview
- Facebook's revenue and net income from 2007 to 2018 (in million U.S. dollars)Facebook: annual revenue and net income 2007-2018
- Facebook's annual revenue from 2009 to 2018, by segment (in million U.S. dollars)Facebook: annual revenue 2009-2018, by segment
- Facebook's global revenue as of 4th quarter 2018 (in million U.S. dollars)Facebook: worldwide quarterly revenue 2011-2018
- Facebook's global revenue as of 4th quarter 2018, by segment (in million U.S. dollars)Facebook: worldwide quarterly revenue 2010-2018, by segment
- Facebook's net income from 1st quarter 2010 to 4th quarter 2018 (in million U.S. dollars)Facebook: quarterly net income 2010-2018
- Compensation of Facebook's leading executive officers from 2011 to 2017 (in million U.S. dollars)Most highly compensation executive officers of Facebook 2011-2017
- Number of full-time Facebook employees from 2004 to 2018Number of Facebook employees 2004-2018
- Price of selected acquisitions by Facebook as of July 2017 (in million U.S. dollars)Price of selected acquisitions by Facebook 2017
- Reach
- Which of the following tech and internet companies and brands do you know, if only by name? U.S. consumer awareness of leading tech and internet brands 2017
- How much do you agree with the following statements regarding international tech and internet companies such as Google, Apple, Facebook, and Amazon?U.S. consumer views regarding leading tech and internet brands 2017
- Cumulative number of monthly Facebook product users as of 4th quarter 2018 (in billions)Monthly active users of any Facebook product 2018
- Number of monthly active Facebook users worldwide as of 4th quarter 2018 (in millions)Facebook: number of monthly active users worldwide 2008-2018
- Number of monthly active Facebook users in the United States and Canada as of 4th quarter 2018 (in millions)Facebook: number of monthly active users in North America 2010-2018
- Number of daily active Facebook users worldwide as of 4th quarter 2018 (in millions)Facebook: number of daily active users worldwide 2011-2018
- Number of Facebook users worldwide from 2015 to 2020 (in billions)Global number of Facebook users 2015-2020
- Number of Facebook users in the United States from 2017 to 2023 (in millions)United States: number of Facebook users 2017-2023
- Demographics
- Distribution of Facebook users worldwide as of January 2019, by age and genderFacebook: distribution of global audiences 2019, by age and gender
- Distribution of Facebook users in the United States as of January 2018, by age group and genderFacebook: distribution of U.S. users 2018, by age and gender
- Number of Facebook users in the United States as of January 2018, by age group (in millions)Number of U.S. Facebook users 2018, by age
- Percentage of U.S. adults who use Facebook as of January 2018, by genderFacebook usage reach in the United States 2018, by gender
- Percentage of U.S. adults who use Facebook as of January 2018, by age groupFacebook usage reach in the United States 2018, by age group
- Percentage of U.S. adults who use Facebook as of January 2018, by educational backgroundFacebook usage reach in the United States 2018, by education
- Percentage of U.S. internet users who use Facebook as of January 2018, by annual household incomeFacebook usage reach in the United States 2018, by household income
- Percentage of teenagers in the United States who use Facebook as of April 2018, by genderShare of U.S. teenagers who use Facebook 2018, by gender
- Usage
- Which of the following Facebook services and products do you use at least occasionally?U.S. consumer usage of Facebook services and products 2017
- How often do you use Facebook services and products?U.S. usage frequency of Facebook services and products 2017
- Device usage of Facebook users worldwide as of January 2018Facebook access penetration 2018, by device
- Do you use your own user account or a personal account for Facebook services and products?U.S. Facebook product and service usage via personal account 2017
- Most popular activities of Facebook users worldwide as of 1st quarter 2016Facebook: most popular user activities 2016
- Most popular Facebook activities in the United States as of October 2017Facebook activities of users in the United States 2017
- Frequency of Facebook use in the United States as of February 2018Facebook usage frequency in the United States 2018
- Reasons for internet users in the United States to not use Facebook as of October 2017Reasons for non-usage of Facebook according to U.S. internet users 2017
- Advertising
- Facebook's advertising revenue worldwide from 2009 to 2018 (in million U.S. dollars)Facebook: advertising revenue worldwide 2009-2018
- Facebook's annualized revenue per user from 2012 to 2018 (in U.S. dollars)Facebook: revenue per user 2011-2018
- Facebook's average revenue per user as of 4th quarter 2018, by region (in U.S. dollars)Facebook: average revenue per user 2011-2018, by region
- Share of Facebook's mobile advertising revenue from 2012 to 2018Facebook: mobile advertising revenue share 2012-2018
- Average number of daily content and net page likes on Facebook as of 1st half 2018, by verticalAverage daily Facebook content and net page likes 2018, by vertical
- Average number of daily brand posts on Facebook as of 1st half 2018, by verticalAverage daily Facebook brand posts 2018, by vertical
- Average number of daily comments on brand posts on Facebook as of 1st half 2018, by verticalAverage daily Facebook brand post comments 2018, by vertical
- Most popular Facebook fan pages as of January 2019, based on number of fans (in millions)Most popular Facebook fan pages 2019
- Facebook: global sponsored stories revenue via mobile 2013-2021
- Facebook: share of mobile app time 2014, by age
- Facebook: online reach in the Philippines 2017-2023
- Arab Spring: Facebook penetration at the start of protests in 2011, by country
- Facebook: global social media referral traffic share 2012-2014
- Facebook: leading banks in Spain as of August 2017, by number of followers
- Facebook' share of digitial advertising spending in the United Kingdom (UK) 2012-2016
- Facebook online reach in Malaysia 2017-2023
- UK share of Facebook's global ad revenues 2012-2016
- Drop outs from Facebook, Twitter and YouTube in the Netherlands 2016
- Facebook: global mobile app install ad revenue 2013-2021
- Facebook: global sponsored stories revenue via desktop 2013-2021
- Trust in Facebook news in the U.S. 2016, by ethnicity
- Facebook: Awareness in the United Kingdom (UK) March 2013-April 2015
- Distribution of Facebook users New Zealand 2018 by age and gender
- UK: openness about using adult dating portals 2017, by usage of dating site or app
- Sales share of globally leading consumer products companies 2013, by country/region
- Facebook
- Facebook Messenger
- Facebook in the United Kingdom (UK)
- Google, Apple, Facebook, and Amazon (GAFA)
- Facebook and Instagram in the Benelux region
- Social media usage in the Netherlands
- Social media usage in Belgium
- Facebook Engagement Insights & Benchmarks (v01)
- Social media usage in India
- Facebook Annual Report 2018
- Social media usage worldwide
- Social media marketing
- Social media usage in the United States
- Social media usage in the United Kingdom (UK)
- Facebook Annual Report 2017
- Facebook's revenue and net income from 2007 to 2018 (in million U.S. dollars)
- Facebook's annual revenue from 2009 to 2018, by segment (in million U.S. dollars)
- Facebook's global revenue as of 4th quarter 2018 (in million U.S. dollars)
- Facebook's global revenue as of 4th quarter 2018, by segment (in million U.S. dollars)
- Facebook's net income from 1st quarter 2010 to 4th quarter 2018 (in million U.S. dollars)
- Price of selected acquisitions by Facebook as of July 2017 (in million U.S. dollars)
- Global number of user data requests issued to Facebook from federal agencies and governments during 1st half 2018, by country
- Facebook's federal lobbying expenses from 1st quarter 2011 to 4th quarter 2018 (in 1,000 U.S. dollars)
- Cumulative number of monthly Facebook product users as of 4th quarter 2018 (in billions)
- Number of monthly active Facebook users worldwide as of 4th quarter 2018 (in millions)
- Number of monthly active Facebook users in the United States and Canada as of 4th quarter 2018 (in millions)
- Number of daily active Facebook users worldwide as of 4th quarter 2018 (in millions)
- Number of Facebook users worldwide from 2015 to 2020 (in billions)
- Number of Facebook users in the United States from 2017 to 2023 (in millions)
- Leading countries based on number of Facebook users as of January 2019 (in millions)
- Facebook usage penetration in the United States from 2017 to 2023
- Number of monthly active Facebook Messenger users from April 2014 to September 2017 (in millions)
- If you had to guess, about how many of your friends and family have Facebook profiles?
- Distribution of Facebook users worldwide as of January 2019, by age and gender
- Distribution of Facebook users in the United States as of January 2018, by age group and gender
- Percentage of U.S. adults who use Facebook as of January 2018, by gender
- Percentage of U.S. adults who use Facebook as of January 2018, by age group
- Percentage of U.S. adults who use Facebook as of January 2018, by educational background
- Percentage of U.S. internet users who use Facebook as of January 2018, by annual household income
- Device usage of Facebook users worldwide as of January 2018
- Most popular Facebook activities in the United States as of October 2017
- Frequency of Facebook use in the United States as of February 2018
- Reasons for internet users in the United States to not use Facebook as of October 2017
- Selected global media and sporting events with the most Facebook interactions as of May 2017 (in million interactions)
- Most popular Facebook games as of December 2018, based on monthly active users (in millions)
- Most popular Facebook games as of January 2019, based on number of daily active users (in millions)
- Facebook's annualized revenue per user from 2012 to 2018 (in U.S. dollars)
- Facebook's average revenue per user as of 4th quarter 2018, by region (in U.S. dollars)
- Share of Facebook's mobile advertising revenue from 2012 to 2018
- Average number of daily brand posts on Facebook as of 1st half 2018, by vertical
- Average number of daily comments on brand posts on Facebook as of 1st half 2018, by vertical
- Most popular Facebook fan pages as of January 2019, based on number of fans (in millions)
- Product brands with the most Facebook fans as of April 2018 (in millions)
- Technology brands with the most Facebook fans as of April 2018 (in millions)
- Worldwide sponsored stories ad revenue via mobile of Facebook from 2013 to 2021 (in million U.S. dollars)
- Share of mobile app time spent on Facebook in the United States as of June 2014, by age group
- Facebook usage penetration in the Philippines from 2017 to 2023
- Facebook penetration rates in MENA countries at the start of the Arab Spring demonstrations in 2011
- Facebook's share of worldwide social media referral traffic from November 2012 to December 2014
- Facebook usage penetration in Malaysia from 2017 to 2023
- Worldwide sponsored stories ad revenue via desktop of Facebook from 2013 to 2021 (in million U.S. dollars)
- Share of sales of the world's leading 250 consumer products companies in 2013, by country/region
- Compensation of Facebook's leading executive officers from 2011 to 2017 (in million U.S. dollars)
- Number of full-time Facebook employees from 2004 to 2018
- Revenue of selected social media companies from 2014 to 2018 (in million U.S. dollars)
- Which of the following tech and internet companies and brands do you know, if only by name?
- How much do you agree with the following statements regarding international tech and internet companies such as Google, Apple, Facebook, and Amazon?
- Most popular global mobile messenger apps as of January 2019, based on number of monthly active users (in millions)
- Number of Facebook users in the United States as of January 2018, by age group (in millions)
- Percentage of teenagers in the United States who use Facebook as of April 2018, by gender
- Percentage of teenagers in the United States who use Facebook as of April 2018, by age group
- Which of the following Facebook services and products do you use at least occasionally?
- How often do you use Facebook services and products?
- Do you use your own user account or a personal account for Facebook services and products?
- Most popular activities of Facebook users worldwide as of 1st quarter 2016
- How comfortable would you be browsing and paying for products with a messaging application, like Facebook Messenger?
- Facebook's advertising revenue worldwide from 2009 to 2018 (in million U.S. dollars)
- Average number of daily content and net page likes on Facebook as of 1st half 2018, by vertical
- Biggest publishers on Facebook as of September 2018, ranked by total Facebook interactions (in millions)
- Leading banks on Facebook in Spain as of August 2017, by number of followers
- Share of digital advertising spending going on Facebook in the United Kingdom (UK) from 2012 to 2016
- Share of Facebook's global ad revenues coming from the United Kingdom (UK) from 2012 to 2016
- Share of individuals dropping out from Facebook, Twitter and YouTube in the Netherlands in 2016
- Worldwide mobile app install advertising revenue of Facebook from 2013 to 2021 (in million U.S. dollars)
- How much do you trust news that your friends and family share on Facebook?
- Awareness of Facebook in the United Kingdom (UK) from March 2013 to April 2015
- Distribution of Facebook users in New Zealand as of January 2018, by age group and gender
- Share of users of dating site or app who were open about using adult dating portals in the United Kingdom (UK) in June 2017, by user type*
Statista offers dossiers and reports on over 170 industries. With Statista you are always able to make informed decisions and boost your work efficiency.
Internet & Telecommunications
- Social Media
- E-Commerce
- Online Video & Entertainment
- Advertising & Marketing
Consumer Goods & FMCG
- Alcoholic Beverages
- Cleaning Products
- Cosmetics & Personal Care
- Food & Nutrition
Retail & Trade
- Health & Hygiene
- International Trade
- Shopping Behavior
- Sports & Leisure
Travel, Tourism & Hospitality
- Business Travel
- Leisure Travel
- Accomodation
- Restaurants
Society
- Demographics
- Economy
- Education & Science
- Politics & Government
Transportation & Logistics
- Aviation
- Rail Transport
- Vehicles & Road Traffic
- Water Transport
Register in seconds and access exclusive features.
Basic Account |
Instant Access
Premium Account | ||
---|---|---|---|
Our servicesClick the question mark for further information | Free |
$49 per month* | |
Basic statistics | |||
Premium statistics | |||
Graph download
| |||
Download PDF | |||
Excel download
| |||
Register | Purchase now |
This feature is limited to our corporate solutions.
Please contact us to get started with full access to dossiers, forecasts, studies and international data.

The Italian pharmaceutical market is among the fastest growing ones worldwide. This dossier provides data on the trends of the market, with special focus on pharmaceutical segments.

To our 150 Reports we added:
- Global Consumer Survey content
- Operational risk index by Fitch
- And more …

The global plastics industry is growing by approximately three percent every year. This dossier provides information about the global plastics industry in general as well as chapters on the major types of plastic, and recycling rates.

Updates on eCommerce, Digital Media, eTravel, eServices and more
- Market figures for 2018 to 2023
- Company and startup profiles
- User demographics

U.S. coal production has steadily declined in the past decade, but has been in the news in recent years due to President Trump's desire to revitalize the industry. This document provides an overview of the key figures, leading companies, and the employment trends in the U.S. coal mining industry.

This new export feature offers
- Structured graphical representation of the data
- Tailored target group analysis
- Option for further processing

The Polish e-commerce market is one of the fastest developing e-commerce markets in Europe. The latest data for Poland is presented in this dossier.

Plastic waste is an issue of global concern. Since China banned the import of recycled plastic, the U.S. has had to make adjustments to its management of plastic waste. This dossier provides an overview of plastic waste in the U.S.

This dossier provides an overview of hedge funds worldwide. Global hedge fund assets, performance, investors, and other topics are highlighted.

The Outdoor Advertising Association of America covers amongst others
- Number of billboards
- Outdoor advertising revenue
- Number of out-of-home displays

Find data, perceptions & more about
- Economic consequences
- Impact on the labor market
- A second referendum

Understand the recent developments in the Spanish eCommerce market!
- URL-related revenues
- Relevant online store KPIs
- eCommerce-related contacts

- Extended statistical dossier
- Insights, explanations & interpretations
- Challenges of the digital future

eCommerce is rapidly becoming a part of the Latin American shopping culture. The dossier includes data on
- Regional online shopping events
- Events by country

The outline of potential impacts of Brexit on UK industries has been updated in the UK Industry Reports.

Italian enterprises invest significantly in digital marketing. Find out about
- Relevant aspects & KPIs
- New trends
- Different strategies

Statista European Football Benchmark
- The big 5 European leagues
- All about the clubs & fans
- Sponsors & how they fit in
We use cookies to personalize contents and ads, offer social media features, and analyze access to our website. In your browser settings you can configure or disable this, respectively, and can delete any already placed cookies. For details, please see your browser’s Help section (by pressing F1). Please see our privacy statement for details about how we use data.