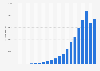
Annual revenue generated by Meta Platforms from 2009 to 2022 (in million U.S. dollars)
Loading statistic...
Basic Account
Get to know the platform
You only have access to basic statistics.
Starter Account
The ideal entry-level account for individual users
- Instant access to 1m statistics
- Download in XLS, PDF & PNG format
- Detailed references
$59 USD $39 USD / Month *
in the first 12 months
Professional Account
Full access
Business Solutions including all features.
* Prices do not include sales tax.
Statistics on Google, Amazon, Meta, Apple, and Microsoft (GAMAM)
Benchmark
8
- Premium Statistic Brand value of the most valuable brands worldwide 2022
- Basic Statistic Market value of the largest internet companies worldwide 2022
- Premium Statistic Revenue of global public internet companies 2014-2021
- Basic Statistic Apple, Google, and Microsoft: revenue comparison 2008-2022
- Basic Statistic Internet companies ranked by revenue 2017-2022
- Premium Statistic Revenue growth of leading tech companies 2018-2022
- Premium Statistic Biggest revenue source of leading tech companies 2022
- Premium Statistic Revenue per employee of leading tech companies 2021
Market concentration
8
- Basic Statistic Leading websites worldwide 2022, by monthly visits
- Basic Statistic Most visited multi-platform U.S. web properties 2022
- Premium Statistic Leading iPhone apps worldwide 2022, by downloads
- Premium Statistic Leading Android apps worldwide 2022, by downloads
- Basic Statistic Revenue split for app stores worldwide 2022
- Premium Statistic Digital audio purchases by brand in the U.S. 2022
- Premium Statistic Digital video purchases by brand in the U.S. 2022
- Premium Statistic Smartphone OS shipment market share worldwide 2020-2025
Google
7
- Basic Statistic Google: global annual revenue 2002-2022
- Basic Statistic Google sites: advertising revenue 2001-2022
- Basic Statistic Google network sites: advertising revenue 2001-2022
- Premium Statistic Google: annual app, media, and hardware revenues 2001-2022
- Basic Statistic Google: quarterly revenue 2008-2022
- Basic Statistic Google: annual operating income 2013-2022
- Basic Statistic Google: quarterly operating income 2014-2022
Amazon
5
Meta
5
Apple
5
- Premium Statistic Apple's revenue worldwide 2004-2022
- Premium Statistic Revenue of Apple by fiscal quarter 2005-2023
- Premium Statistic Apple's revenue share by operating segment 2012-2022, by quarter
- Basic Statistic Apple's net income 2005-2022
- Basic Statistic Global net income of Apple 2005-2023, by quarter
Microsoft
5
- Basic Statistic Microsoft's global revenue 2002-2022
- Premium Statistic Revenue of Microsoft broken down by segment 2012-2022
- Basic Statistic Microsoft's revenue 2008-2023, by fiscal quarter
- Basic Statistic Net income of Microsoft 2002-2022
- Premium Statistic Microsoft's net income 2008-2023, by fiscal quarter
Lobbying expenditure
7
- Premium Statistic Amount spent on lobbying by internet companies in the U.S. 1998-2022
- Basic Statistic Top internet lobbying spenders in the U.S. 2022
- Basic Statistic U.S. lobbying expenses of Alphabet Inc 2015-2022
- Basic Statistic U.S. lobbying expenses of Amazon 2009-2021
- Basic Statistic U.S. lobbying expenses of Apple 2009-2022
- Basic Statistic U.S. lobbying expenses of Meta 2009-2022
- Basic Statistic U.S. lobbying expenses of Microsoft 2009-2022
Environmental, social, and governance (ESG)
8
- Premium Statistic Leading tech companies' scope 1 GHG emissions worldwide 2021
- Premium Statistic Leading tech companies' scope 2 GHG emissions worldwide 2021
- Premium Statistic Leading tech companies' scope 3 GHG emissions worldwide 2021
- Premium Statistic Leading tech companies' electricity consumption worldwide 2021
- Premium Statistic Leading tech companies' total water withdrawal worldwide 2021
- Premium Statistic Leading tech companies' generated waste worldwide 2021
- Premium Statistic Leading tech companies' generated landfill waste worldwide 2021
- Premium Statistic Workforce of leading global online companies 2014-2022
Further related statistics
16
- Facebook: global mobile advertising revenue Q3 2019
- Facebook: mobile advertising revenue share Q3 2019
- Average number of Facebook friends of U.S. users 2016
- Number of mobile phone Facebook users in India 2013-2018
- Facebook: global social media referral traffic share 2012-2014
- U.S. population awareness of Facebook 2012-2021
- Facebook: global mobile advertising revenue 2012-2018
- Number of registered people on Facebook France 2016-2021
- Distribution of Facebook users by gender in France 2016-2021
- Number of Facebook users in Ukraine monthly 2018-2023
- Number of mobile phone Facebook users in Japan 2013-2018
- Indonesia: number of mobile phone Facebook users 2013-2018
- Number of mobile phone Facebook users in the U.S. 2015-2020
- Leading beauty brands on Facebook Egypt 2019, by number of fans
- UK: Facebook data requests from government agencies 2015-2022
- Leading check-in locations on Facebook in summer 2017
Further Content: You might find this interesting as well
Statistics
- Facebook: global mobile advertising revenue Q3 2019
- Facebook: mobile advertising revenue share Q3 2019
- Average number of Facebook friends of U.S. users 2016
- Number of mobile phone Facebook users in India 2013-2018
- Facebook: global social media referral traffic share 2012-2014
- U.S. population awareness of Facebook 2012-2021
- Facebook: global mobile advertising revenue 2012-2018
- Number of registered people on Facebook France 2016-2021
- Distribution of Facebook users by gender in France 2016-2021
- Number of Facebook users in Ukraine monthly 2018-2023
- Number of mobile phone Facebook users in Japan 2013-2018
- Indonesia: number of mobile phone Facebook users 2013-2018
- Number of mobile phone Facebook users in the U.S. 2015-2020
- Leading beauty brands on Facebook Egypt 2019, by number of fans
- UK: Facebook data requests from government agencies 2015-2022
- Leading check-in locations on Facebook in summer 2017
Meta Platforms. (February 1, 2023). Annual revenue generated by Meta Platforms from 2009 to 2022 (in million U.S. dollars) [Graph]. In Statista. Retrieved March 24, 2023, from https://www.statista.com/statistics/268604/annual-revenue-of-facebook/
Meta Platforms. "Annual revenue generated by Meta Platforms from 2009 to 2022 (in million U.S. dollars)." Chart. February 1, 2023. Statista. Accessed March 24, 2023. https://www.statista.com/statistics/268604/annual-revenue-of-facebook/
Meta Platforms. (2023). Annual revenue generated by Meta Platforms from 2009 to 2022 (in million U.S. dollars). Statista. Statista Inc.. Accessed: March 24, 2023. https://www.statista.com/statistics/268604/annual-revenue-of-facebook/
Meta Platforms. "Annual Revenue Generated by Meta Platforms from 2009 to 2022 (in Million U.S. Dollars)." Statista, Statista Inc., 1 Feb 2023, https://www.statista.com/statistics/268604/annual-revenue-of-facebook/
Meta Platforms, Annual revenue generated by Meta Platforms from 2009 to 2022 (in million U.S. dollars) Statista, https://www.statista.com/statistics/268604/annual-revenue-of-facebook/ (last visited March 24, 2023)
Annual revenue generated by Meta Platforms from 2009 to 2022 (in million U.S. dollars) [Graph], Meta Platforms, February 1, 2023. [Online]. Available: https://www.statista.com/statistics/268604/annual-revenue-of-facebook/